Why Power BI: Unlocking the Potential of Data Analytics
Power BI has emerged as one of the most popular business intelligence tools, transforming the way organizations manage, analyze, and visualize their data.
In today’s data-driven world, the ability to make informed decisions quickly is crucial, and Power BI equips businesses with the tools needed to achieve just that.
In this blog, we’ll explore why Power BI is the go-to choice for businesses and data enthusiasts, highlighting its key features, benefits, and unique capabilities.
What is Power BI?
Power BI is a powerful data analytics tool developed by Microsoft. It allows users to connect to multiple data sources, transform raw data, and create interactive dashboards and reports. Designed to be user-friendly, it caters to both technical and non-technical users, making it an ideal solution for organizations of all sizes.
Key Reasons to Choose Power BI
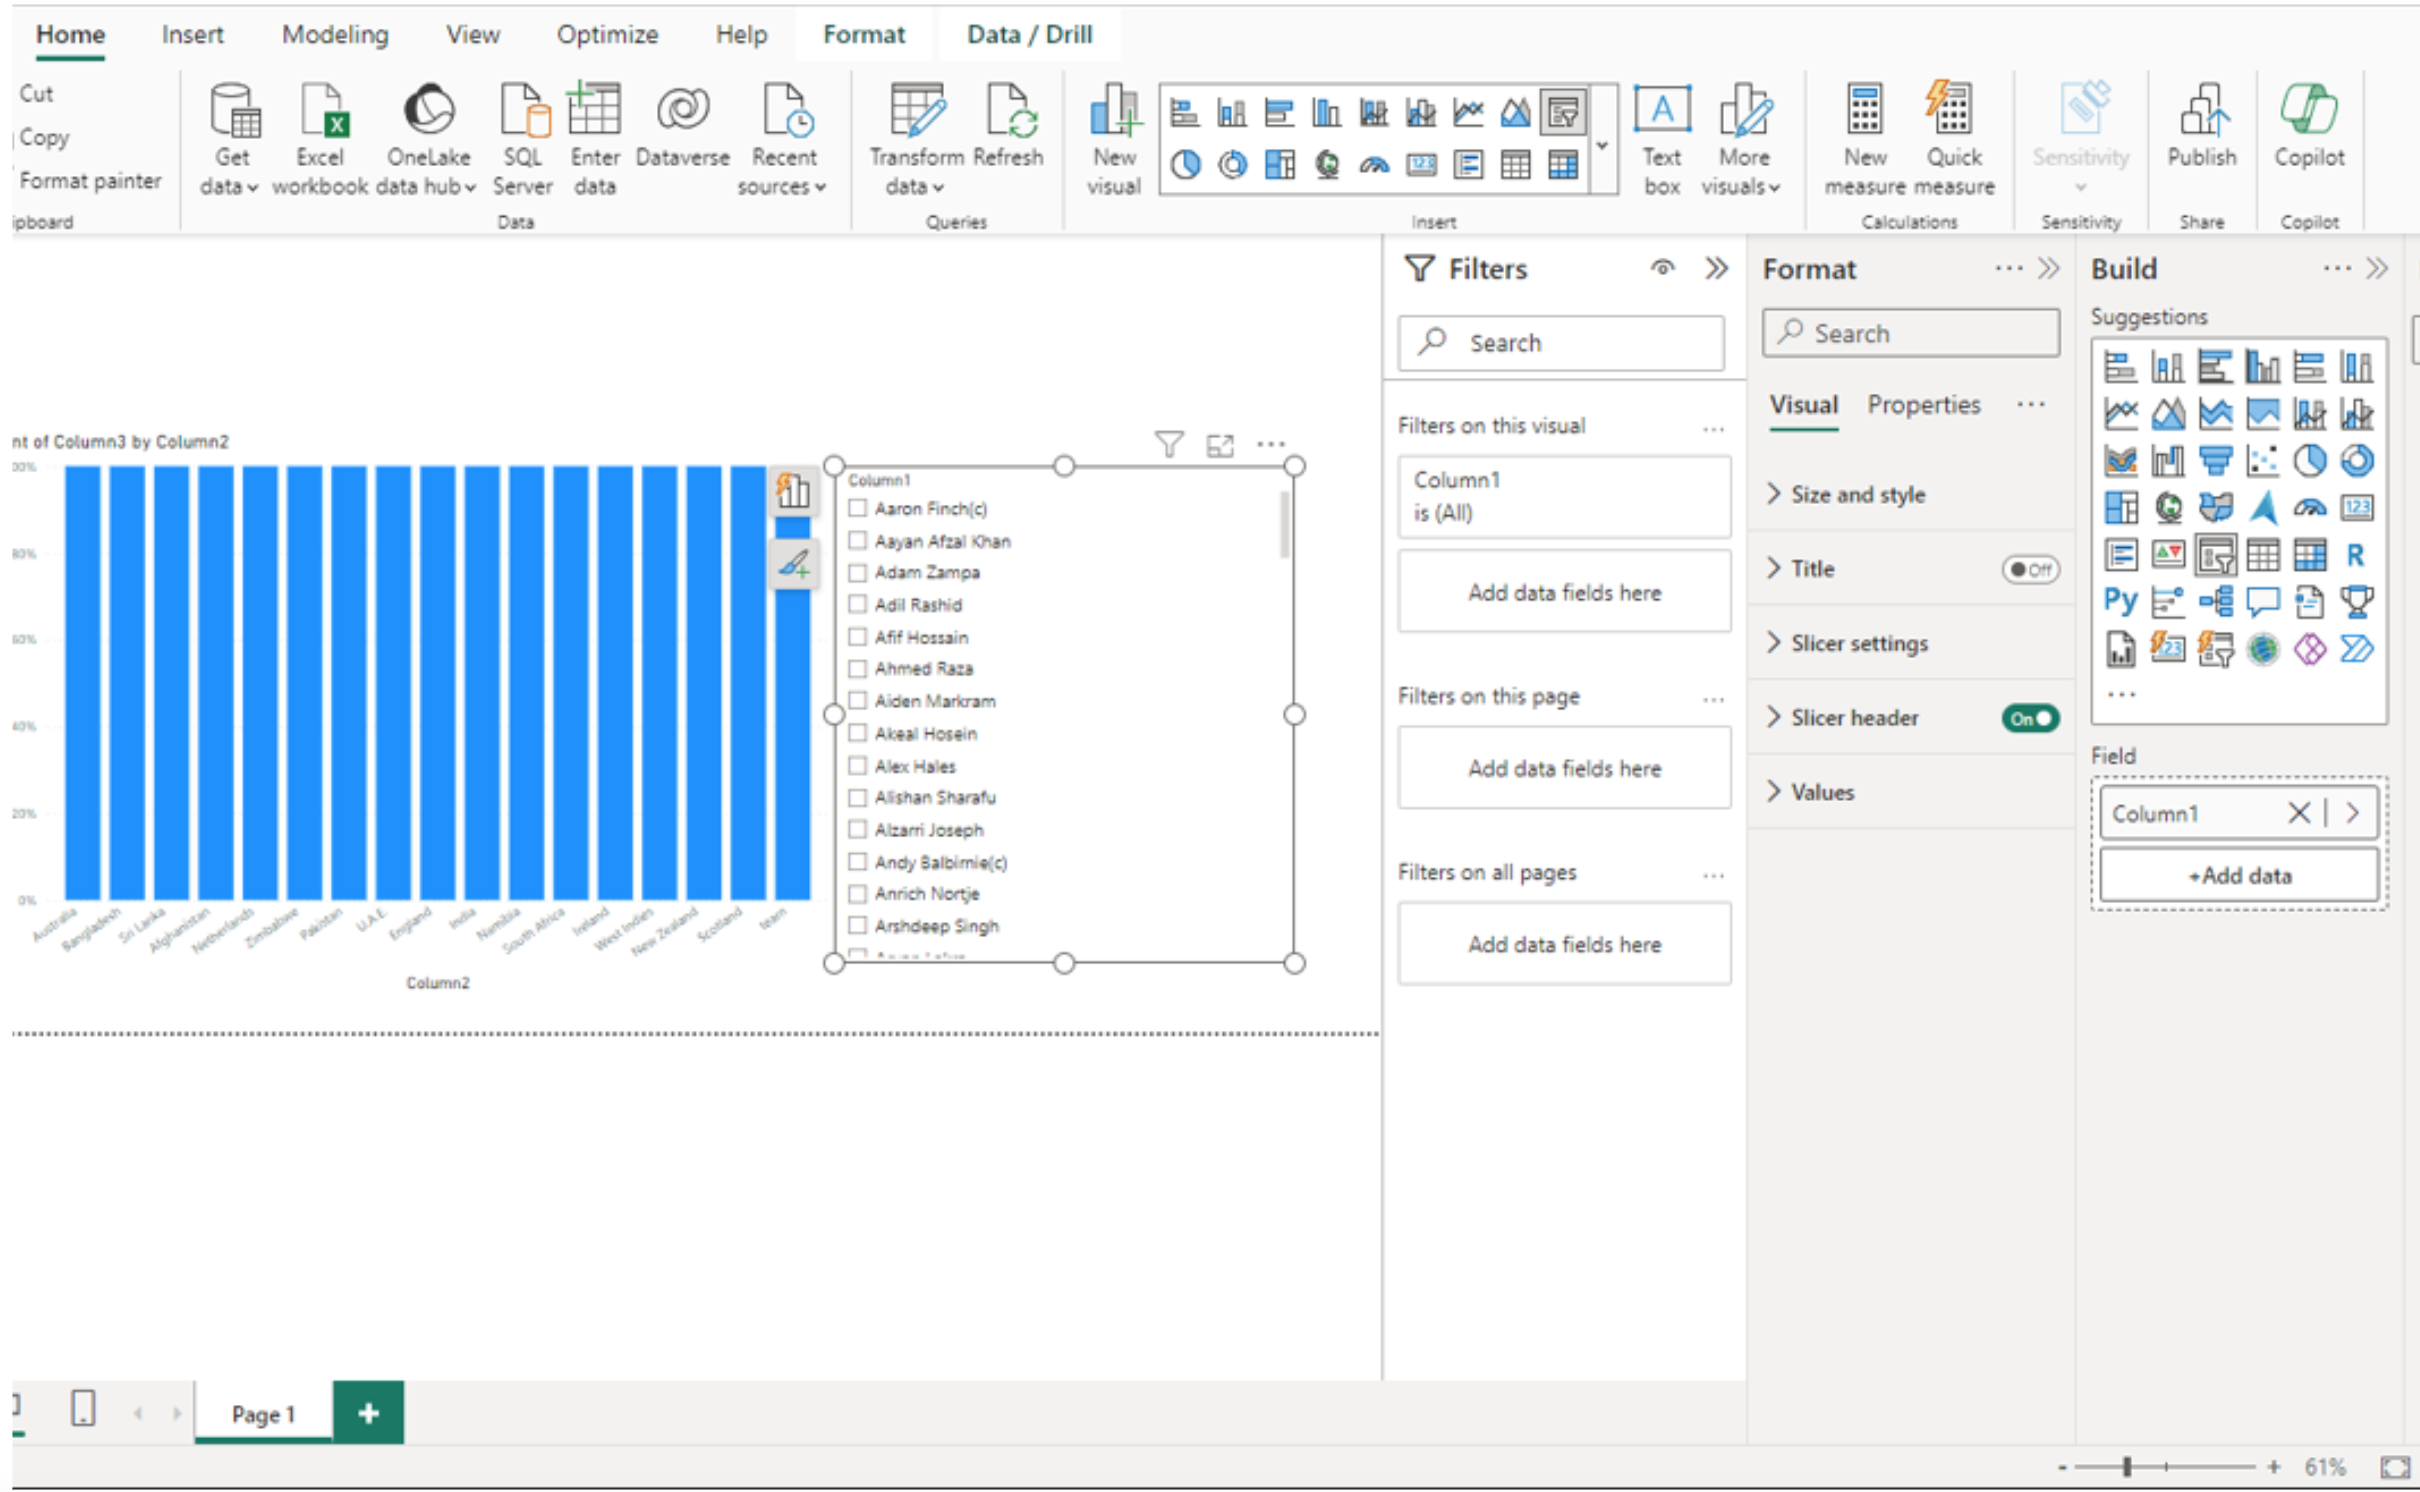
1. User-Friendly Interface
Power BI’s intuitive interface ensures that even beginners can quickly learn and start creating impactful visualizations. The drag-and-drop functionality, pre-built templates, and customizable visuals make it easy to design professional dashboards.
2. Seamless Integration with Microsoft Ecosystem
Power BI integrates effortlessly with other Microsoft tools such as Excel, SharePoint, Teams, and Azure. This seamless connection streamlines workflows and enhances collaboration across departments.
Example: Export data from Excel into Power BI for advanced visualization or embed Power BI reports into Teams for real-time collaboration.
3. Data Connectivity
With Power BI, you can connect to a vast array of data sources, including:
- Databases like SQL Server, MySQL, and Oracle
- Cloud services such as Azure, AWS, and Google Analytics
- Online sources like APIs and web pages
This flexibility allows businesses to create a unified view of their data.
4. Interactive Visualizations
Power BI offers a wide range of interactive visuals, from basic charts to advanced geo-maps and custom visuals from the Microsoft AppSource marketplace. Users can filter data, drill down into specifics, and uncover hidden insights with ease.

Why Choose Power BI Over Competitors?
| Feature | Power BI | Tableau | QlikView |
|---|---|---|---|
| Cost-Effectiveness | ✅ Affordable plans | ❌ Expensive | ❌ Higher cost |
| Microsoft Integration | ✅ Seamless | ❌ Limited | ❌ Limited |
| Learning Curve | ✅ Beginner-friendly | ❌ Steeper | ❌ Steeper |
| Custom Visualizations | ✅ Wide range | ✅ Competitive | ✅ Competitive |
Ready to transform your data into actionable insights?
📌 Explore our Power BI Services to get started today!
Remember: Power BI is not just a tool; it’s a gateway to smarter, faster, and more effective decision-making.