Top Features of Power BI for Data Analysts
Power BI is a versatile data analytics and visualization tool designed to empower businesses with actionable insights. Whether you're an experienced data analyst or just starting your analytics journey, Power BI offers a suite of powerful features that transform the way you work with data.
1. Power Query: Simplified Data Preparation
Data preparation is the foundation of effective analysis, and Power Query makes this process seamless. With a user-friendly interface, Power Query lets you clean, transform, and load data from multiple sources without needing advanced coding skills.

Key Features:
- Automated data cleansing
- Merge and append tables
- Customizable transformation logic
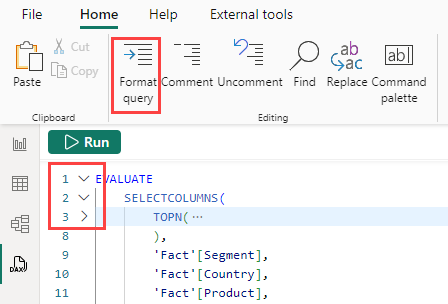
2. DAX (Data Analysis Expressions): Advanced Calculations
Power BI’s DAX language allows for creating calculated columns, measures, and aggregations. Whether you're calculating year-over-year growth or building custom metrics, DAX provides unparalleled flexibility.
Use Cases:
- Custom time intelligence calculations
- Dynamic ranking and filtering
- Advanced mathematical and statistical computations
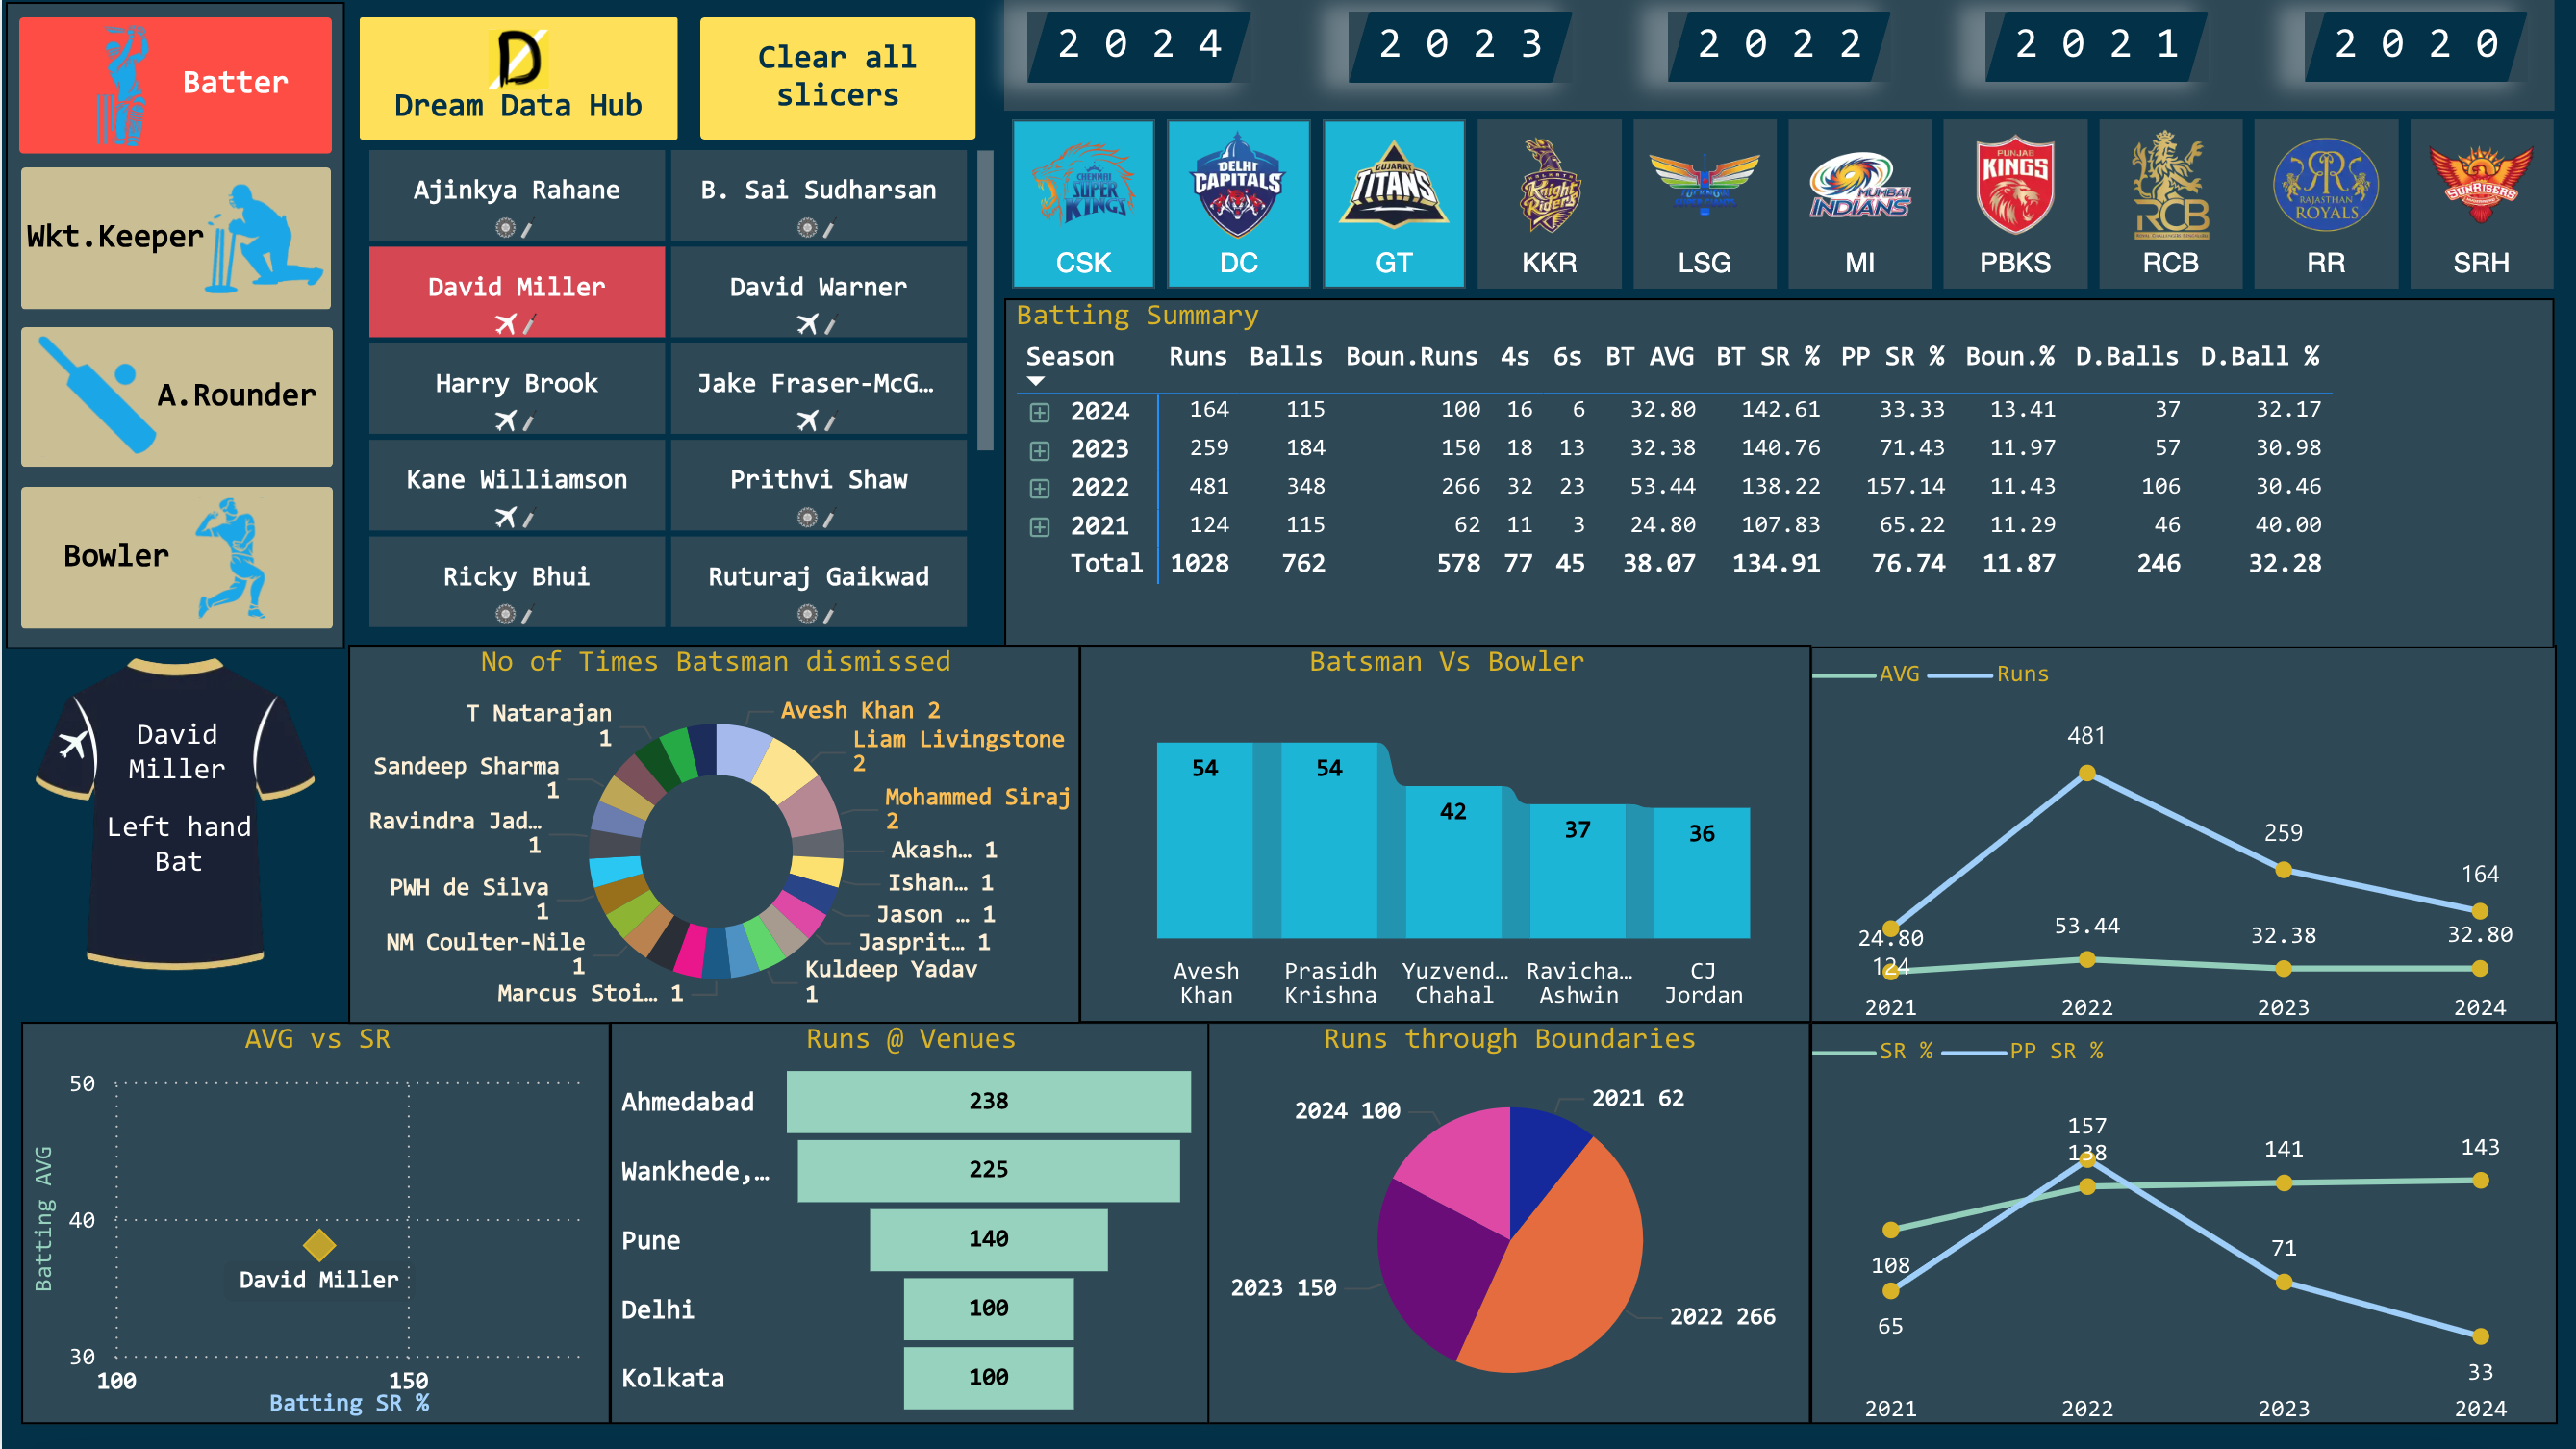
3. Interactive Visualizations and Dashboards
Power BI stands out for its rich visualization options. From bar charts to geo-maps, it offers a wide variety of visuals that can be customized to your data story.
Key Features:
- Drill-down capabilities
- Customizable tooltips
- Real-time data updates
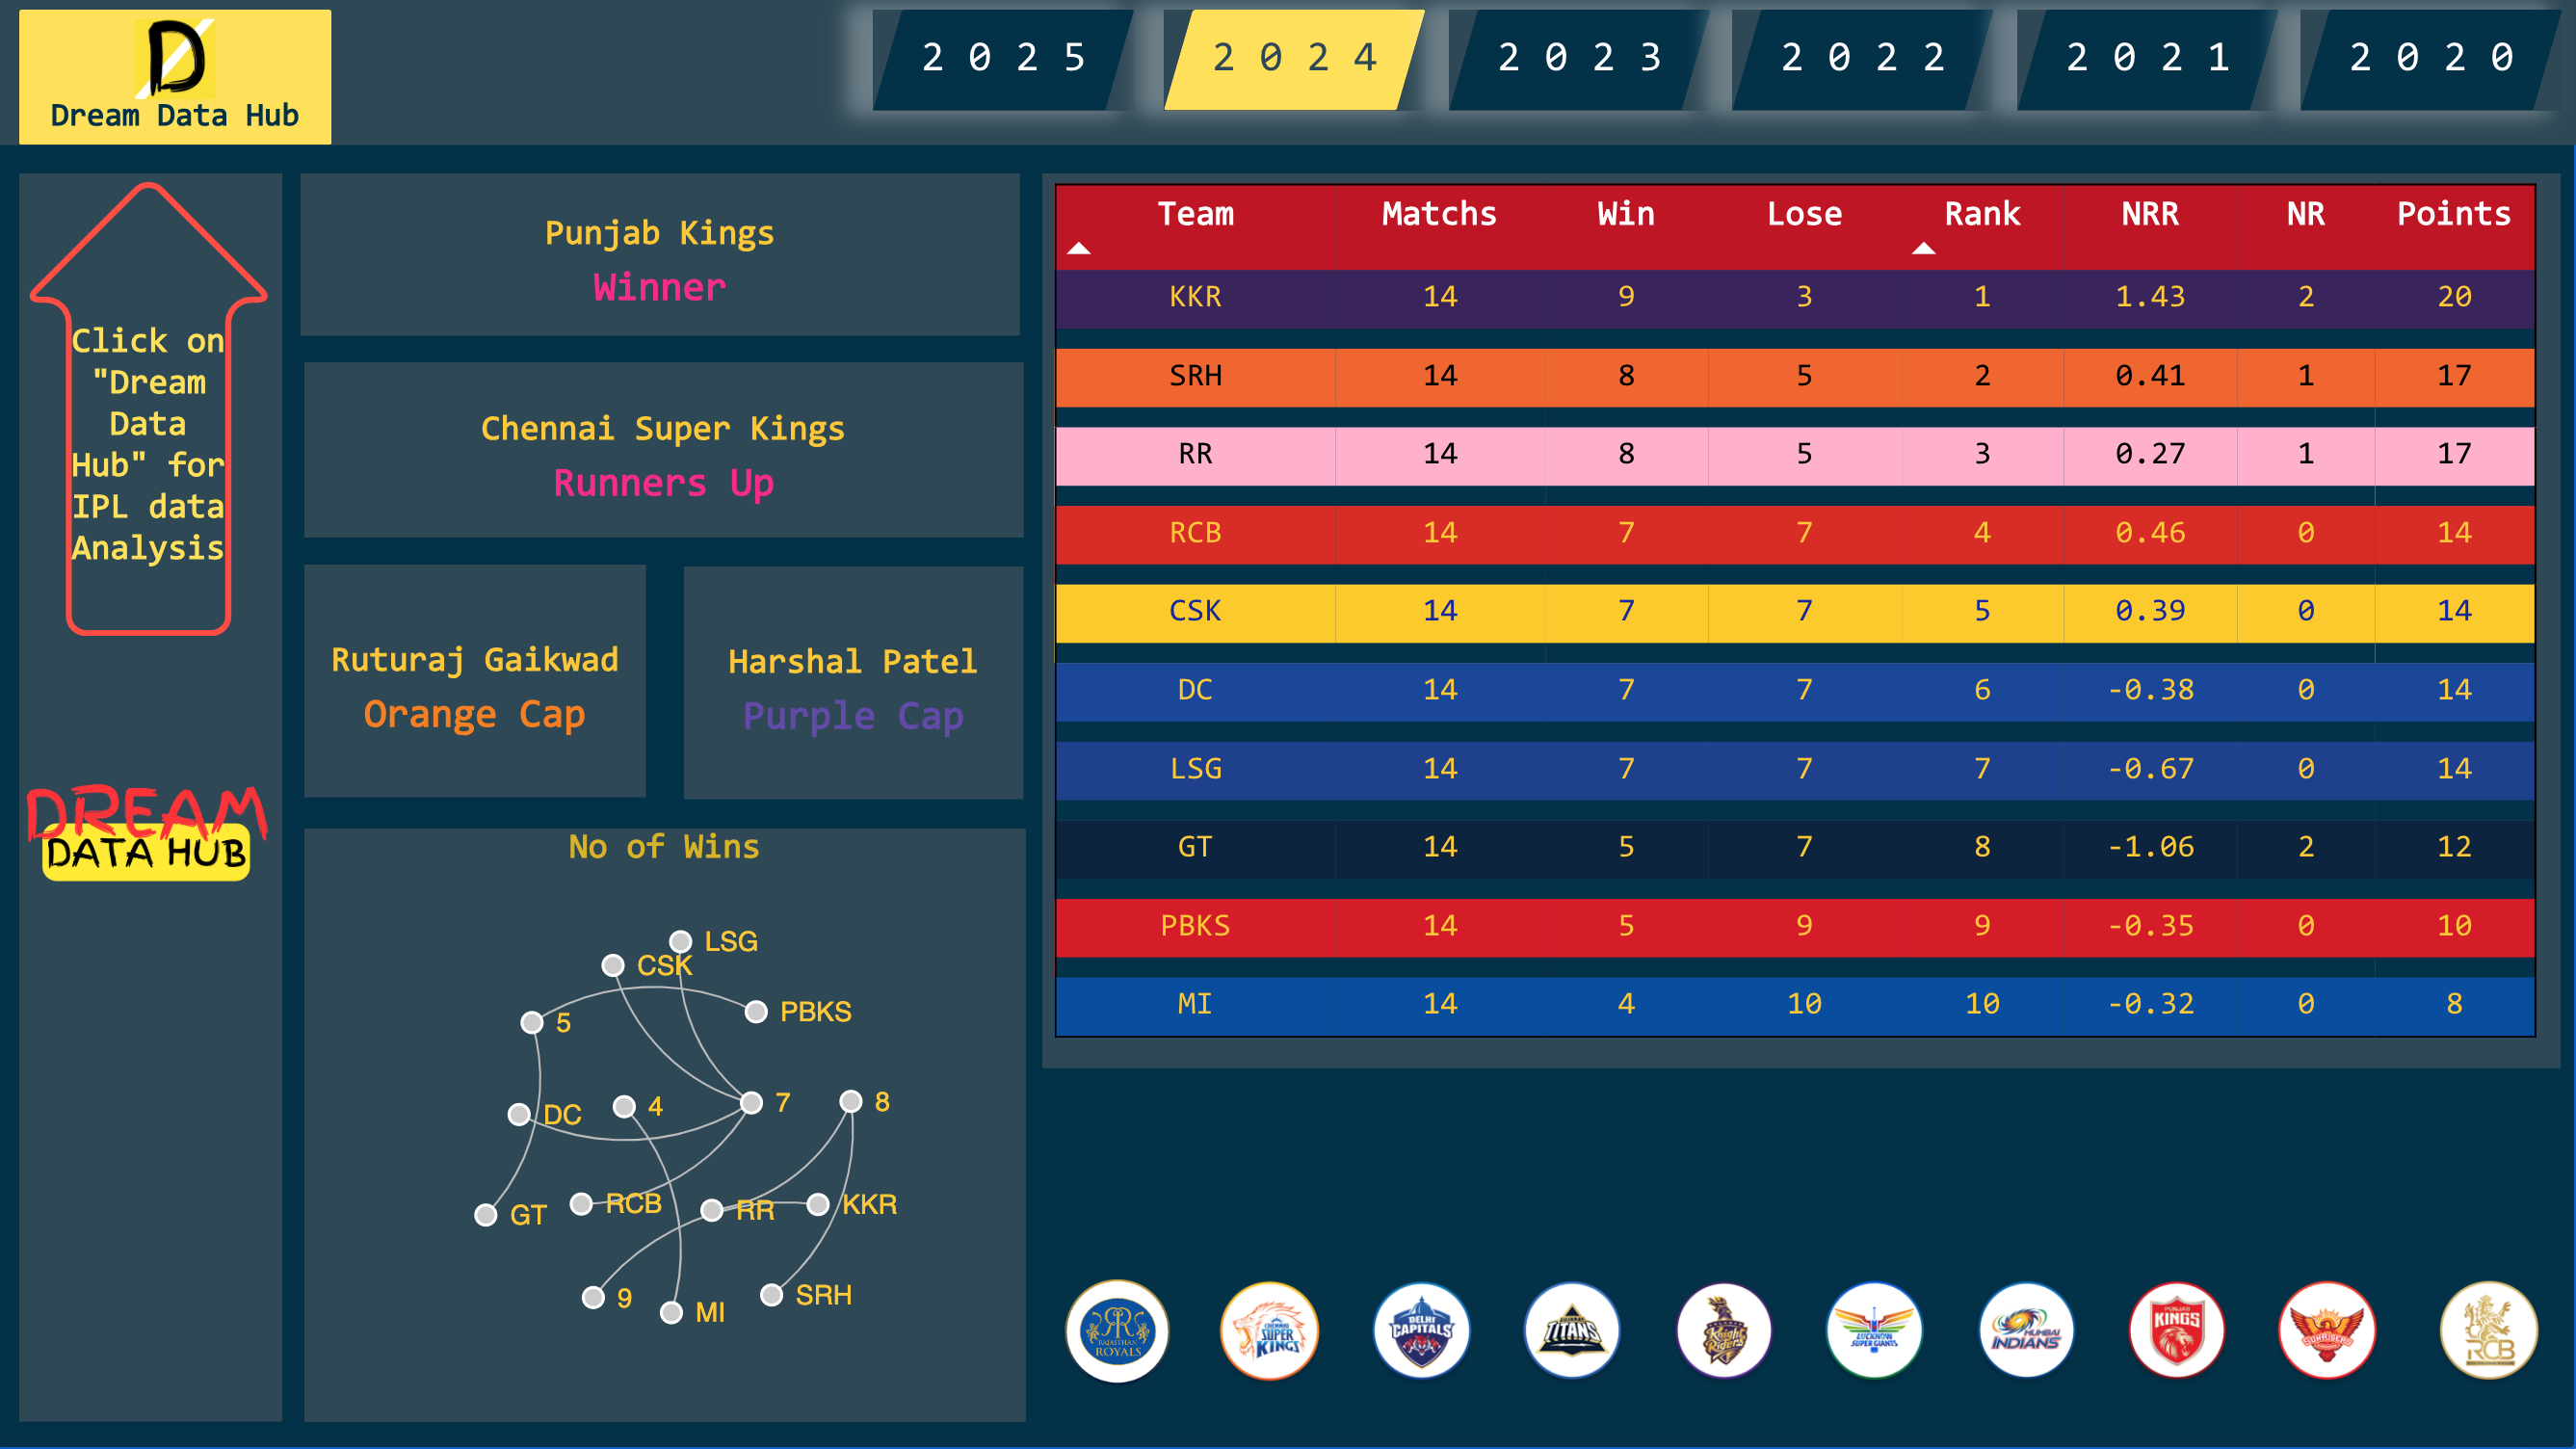
4. Natural Language Query (Q&A)
The Q&A feature allows users to ask questions in plain language, and Power BI generates accurate visual representations instantly. It’s a game-changer for non-technical users.
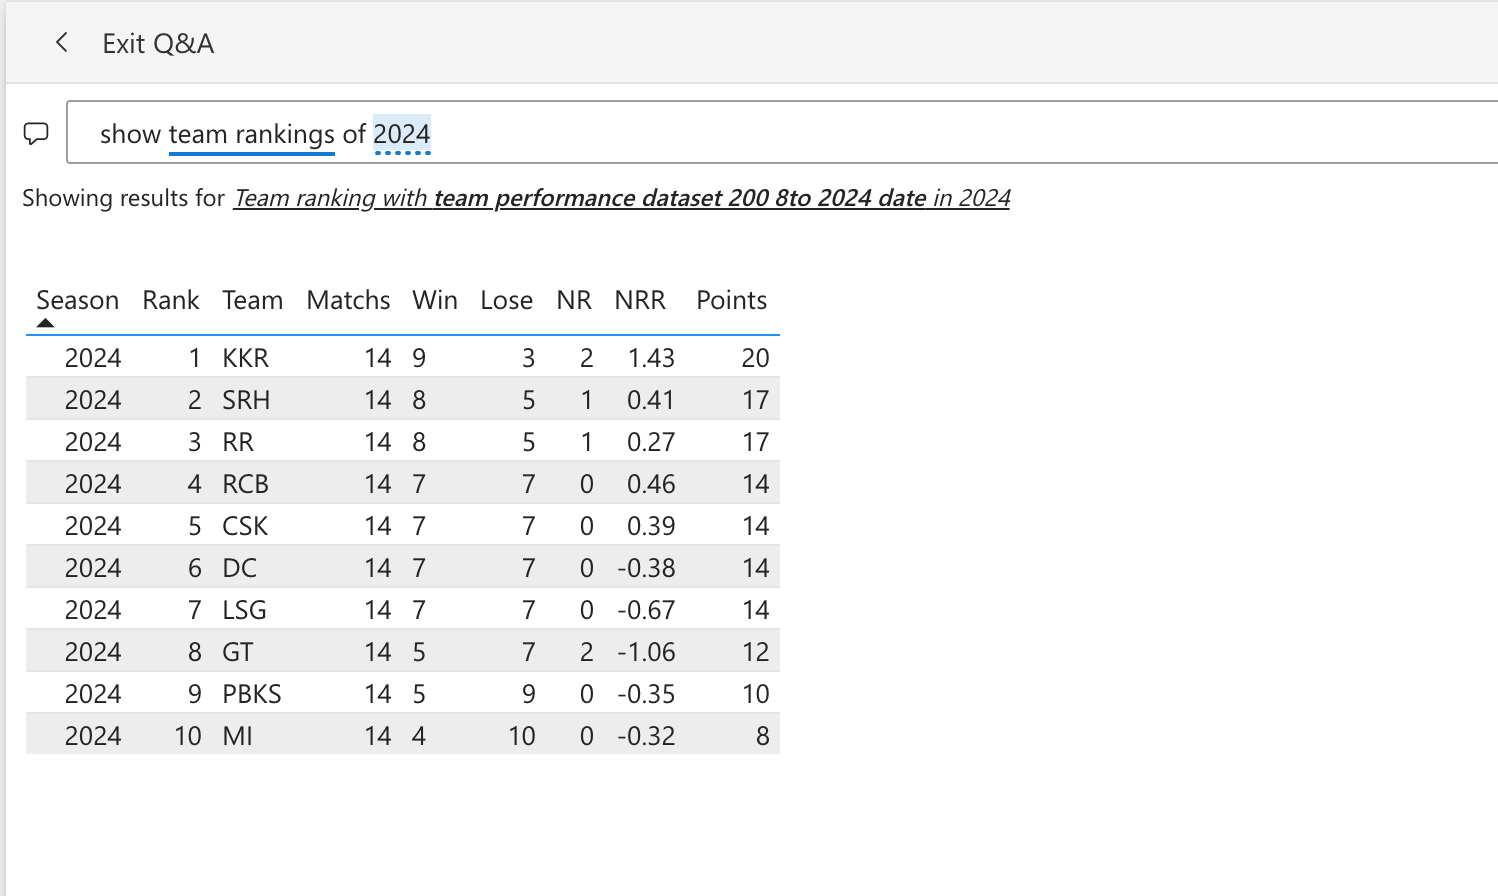
Examples:
- "show team rankings of 2024"
- "Top 5 players of strike rate"
- "Trend of customer growth over the last 6 months"
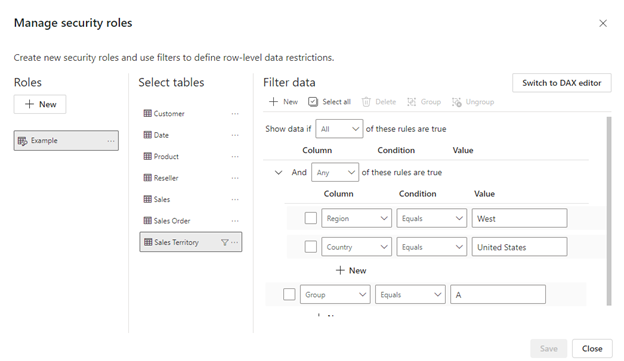
5. Row-Level Security (RLS)
Data security is paramount, and RLS in Power BI ensures that users see only the data they're authorized to access. This is especially critical for organizations handling sensitive information.
Benefits:
- Improved compliance with data privacy regulations
- Enhanced user experience with personalized data views
- Seamless integration with organizational roles and permissions
6. Integration with Microsoft Ecosystem
Power BI integrates seamlessly with tools like Excel, SharePoint, and Teams. This interoperability streamlines workflows and enhances collaboration.
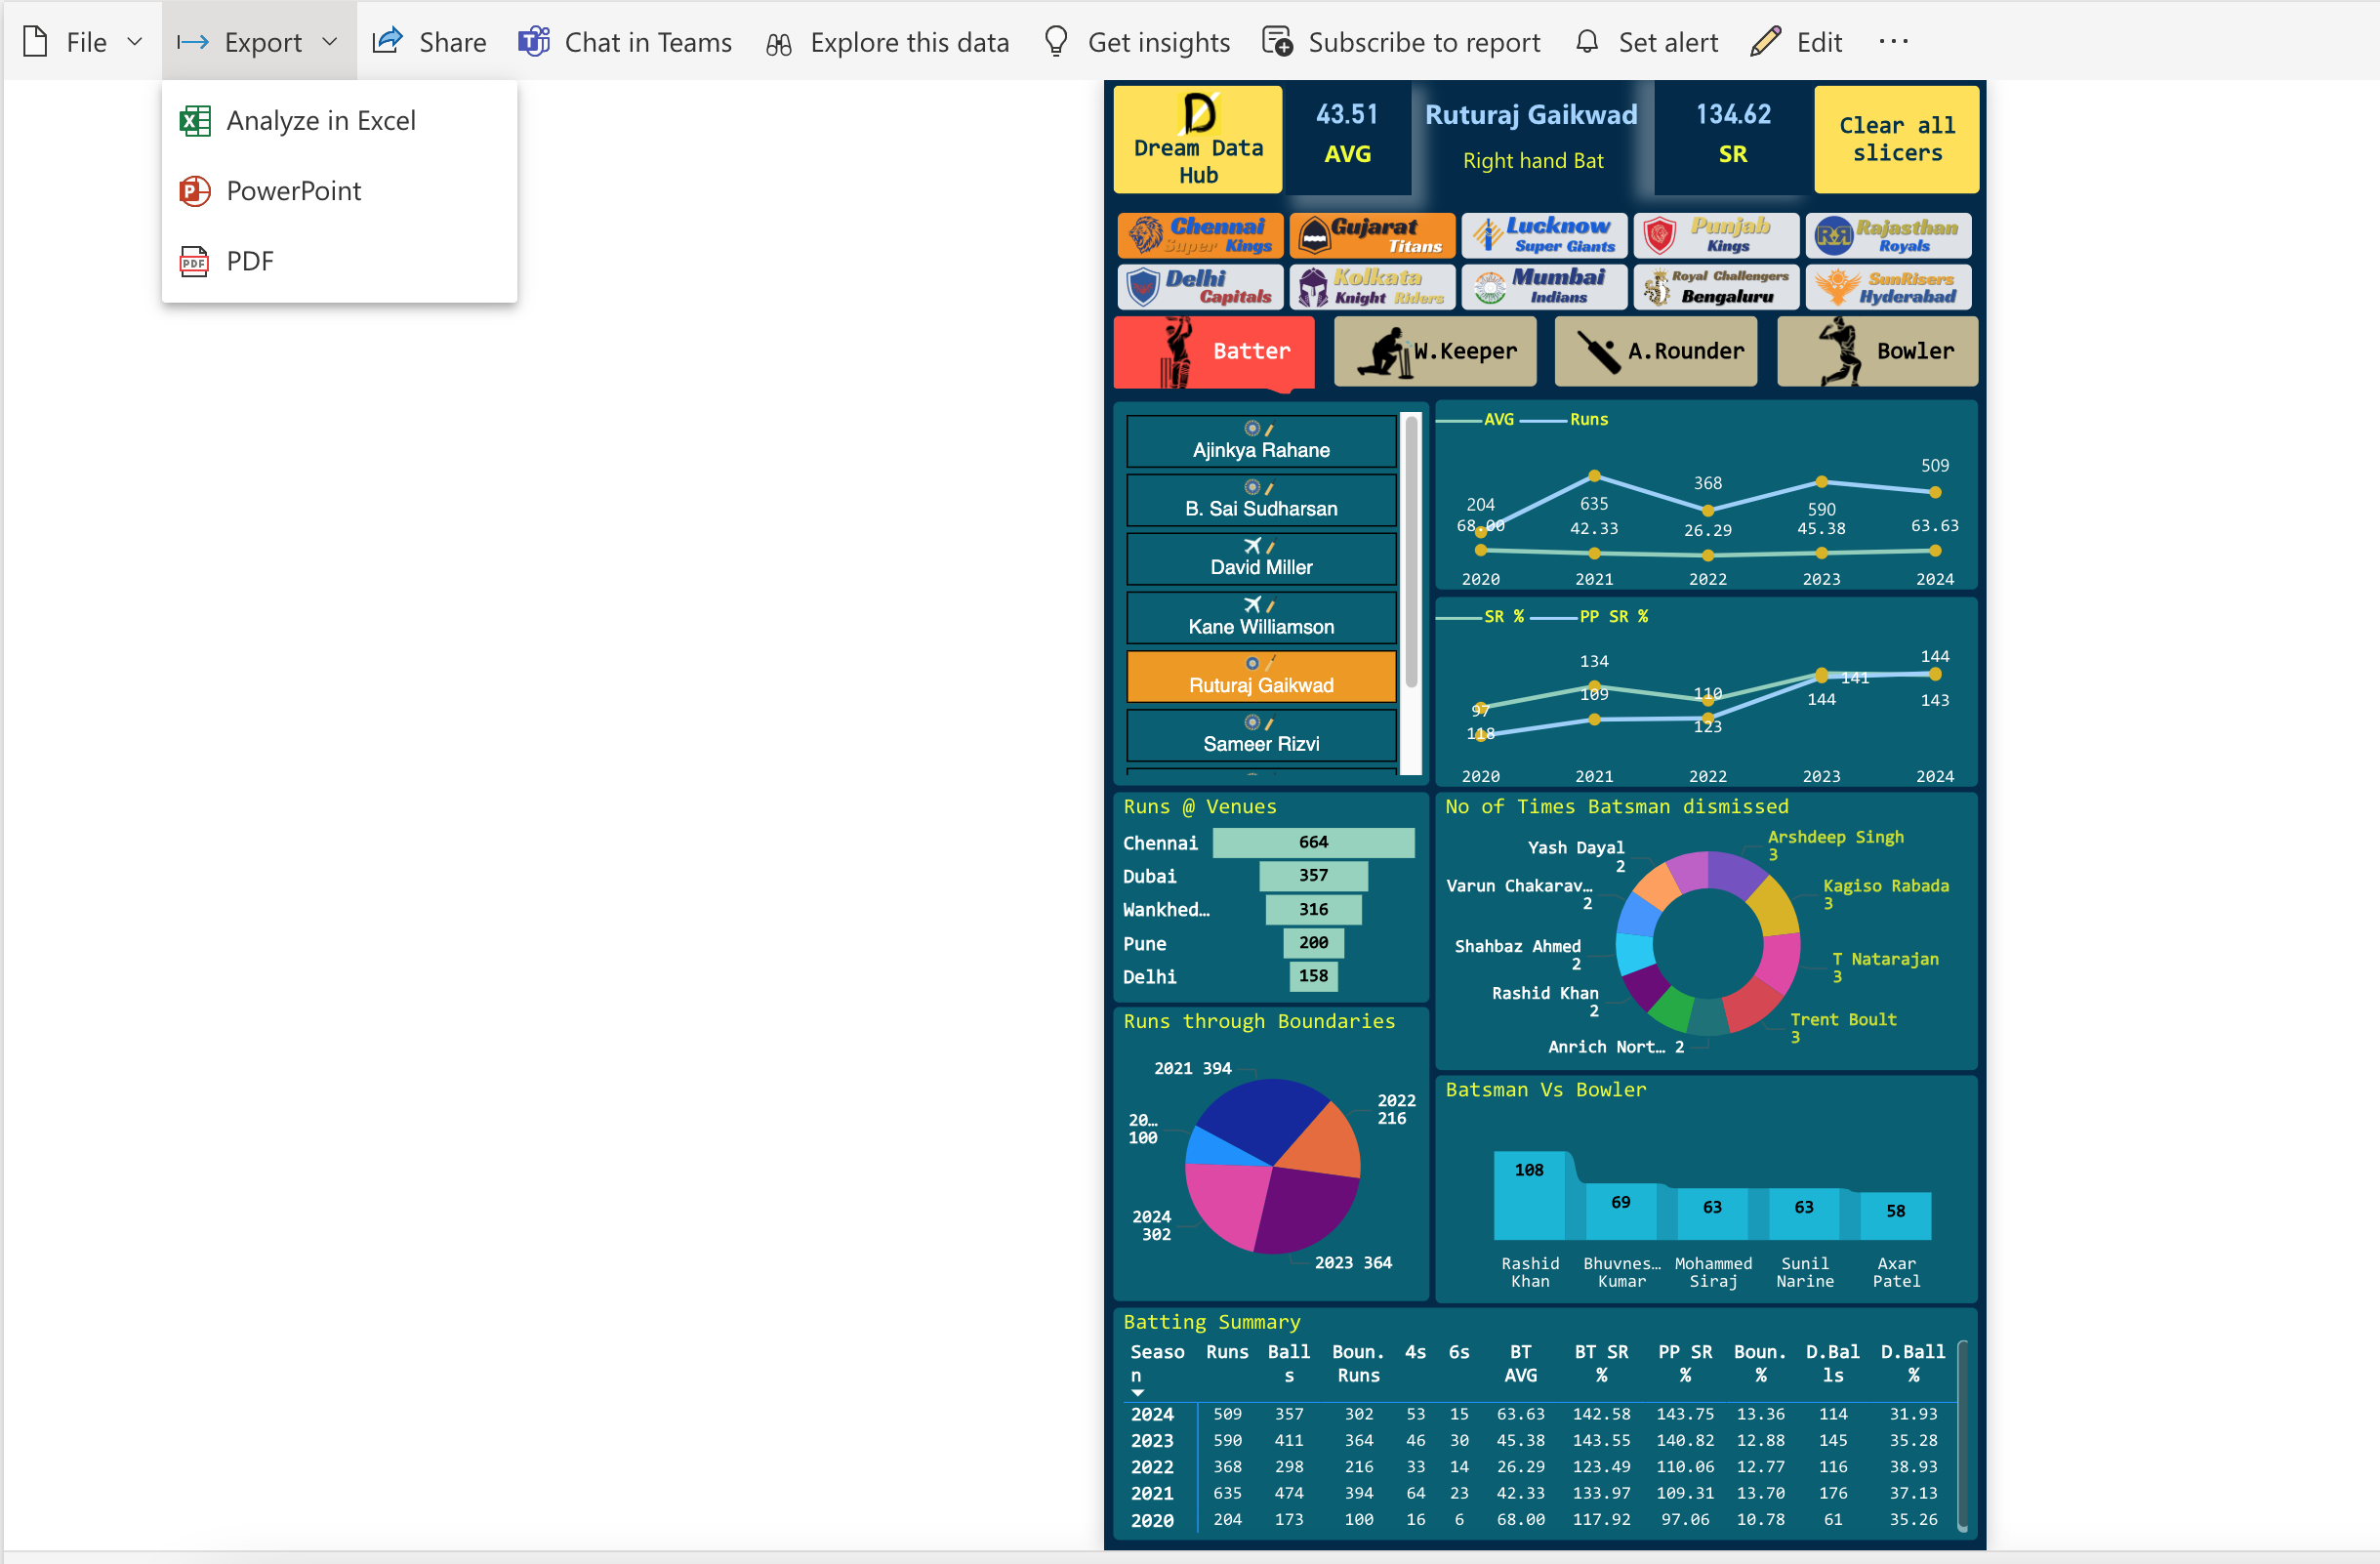
Common Scenarios:
- Automated report sharing via Teams
- Embedding dashboards in SharePoint
- Exporting data models to Excel for advanced analysis
Conclusion
Power BI offers a robust platform for data analysts, with features tailored to tackle complex data challenges. Whether it’s transforming raw data, creating stunning visualizations, or ensuring secure data access, Power BI equips analysts with the tools to deliver value-driven insights.
Start exploring Power BI today and unlock the full potential of your data.