Getting Started with Power BI
Power BI is a powerful business analytics tool from Microsoft that allows you to connect to various data sources, transform data, and create interactive visualizations and reports. If you’re a beginner looking to dive into the world of data analytics, Power BI is a fantastic place to start. In this guide, we’ll walk you through the essentials—from connecting to data sources to creating your very first dashboard.
What is Power BI?
Power BI is a suite of tools designed for data analysis and sharing insights. It enables businesses and individuals to turn raw data into meaningful insights through:
- Interactive Dashboards
- Customizable Visualizations
- Automated Data Refresh
- Cloud-Based Sharing and Collaboration
Step 1: Downloading and Installing Power BI Desktop
To get started, download Power BI Desktop from the official Microsoft Power BI site . It’s free to use and serves as the primary workspace for creating dashboards and reports.
Steps to install:
-
Visit the Power BI download page.
.
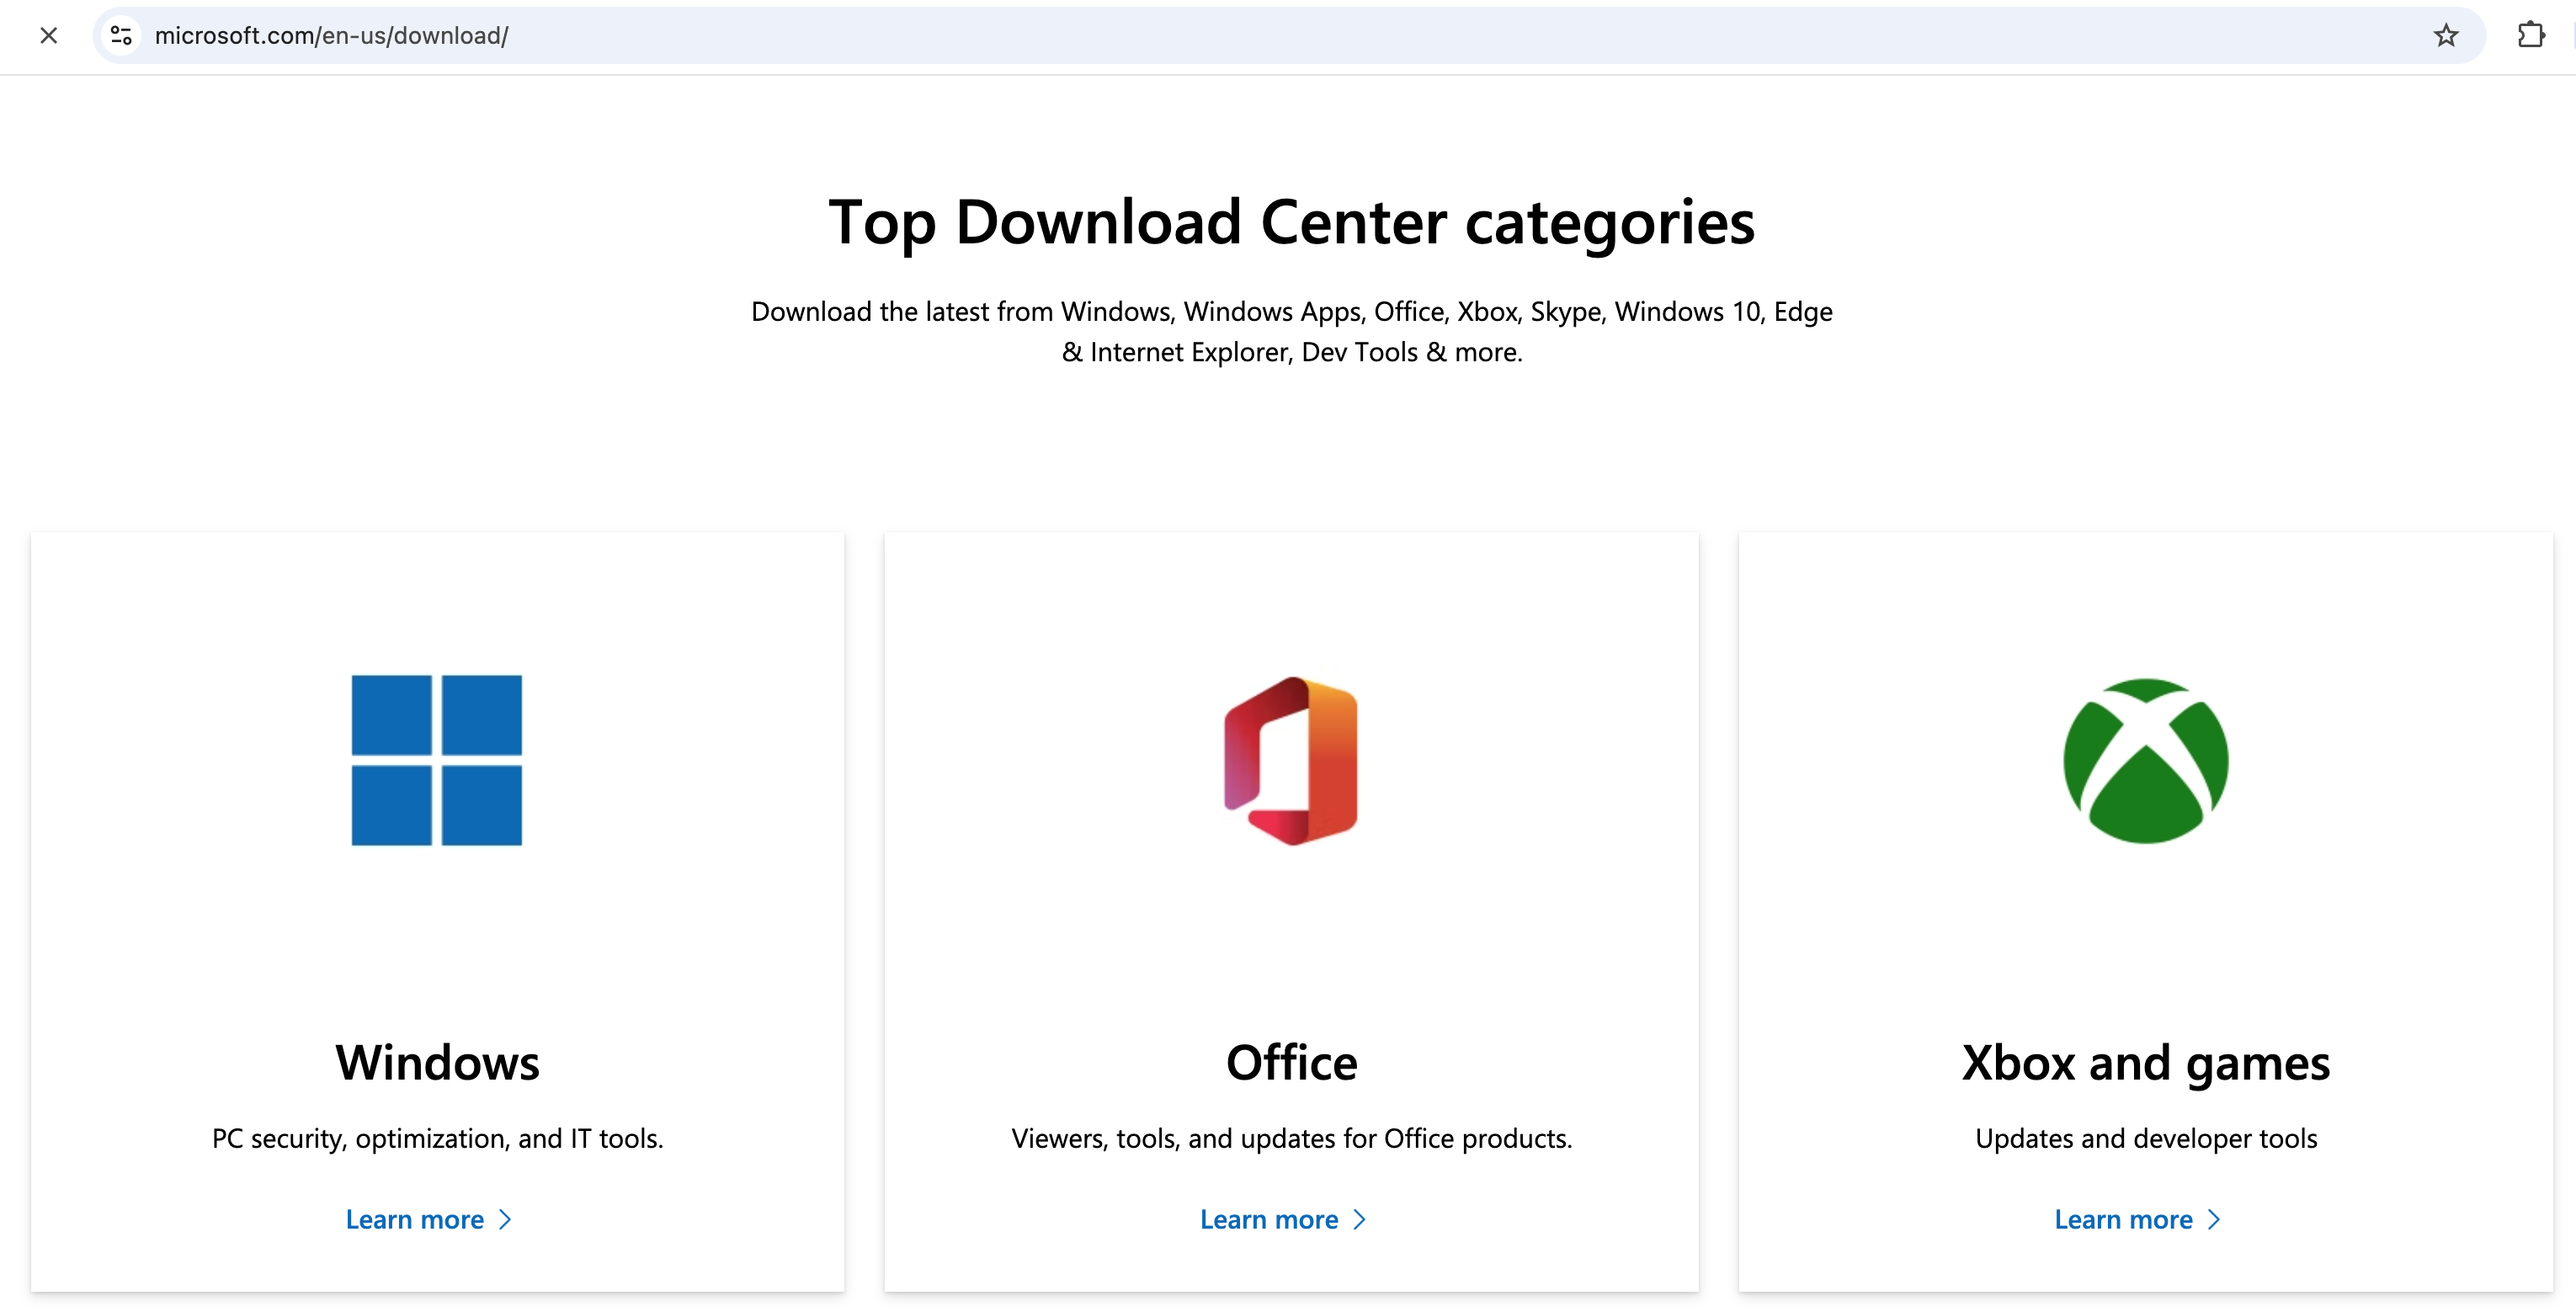
-
Select “Power BI Desktop” and download the application.
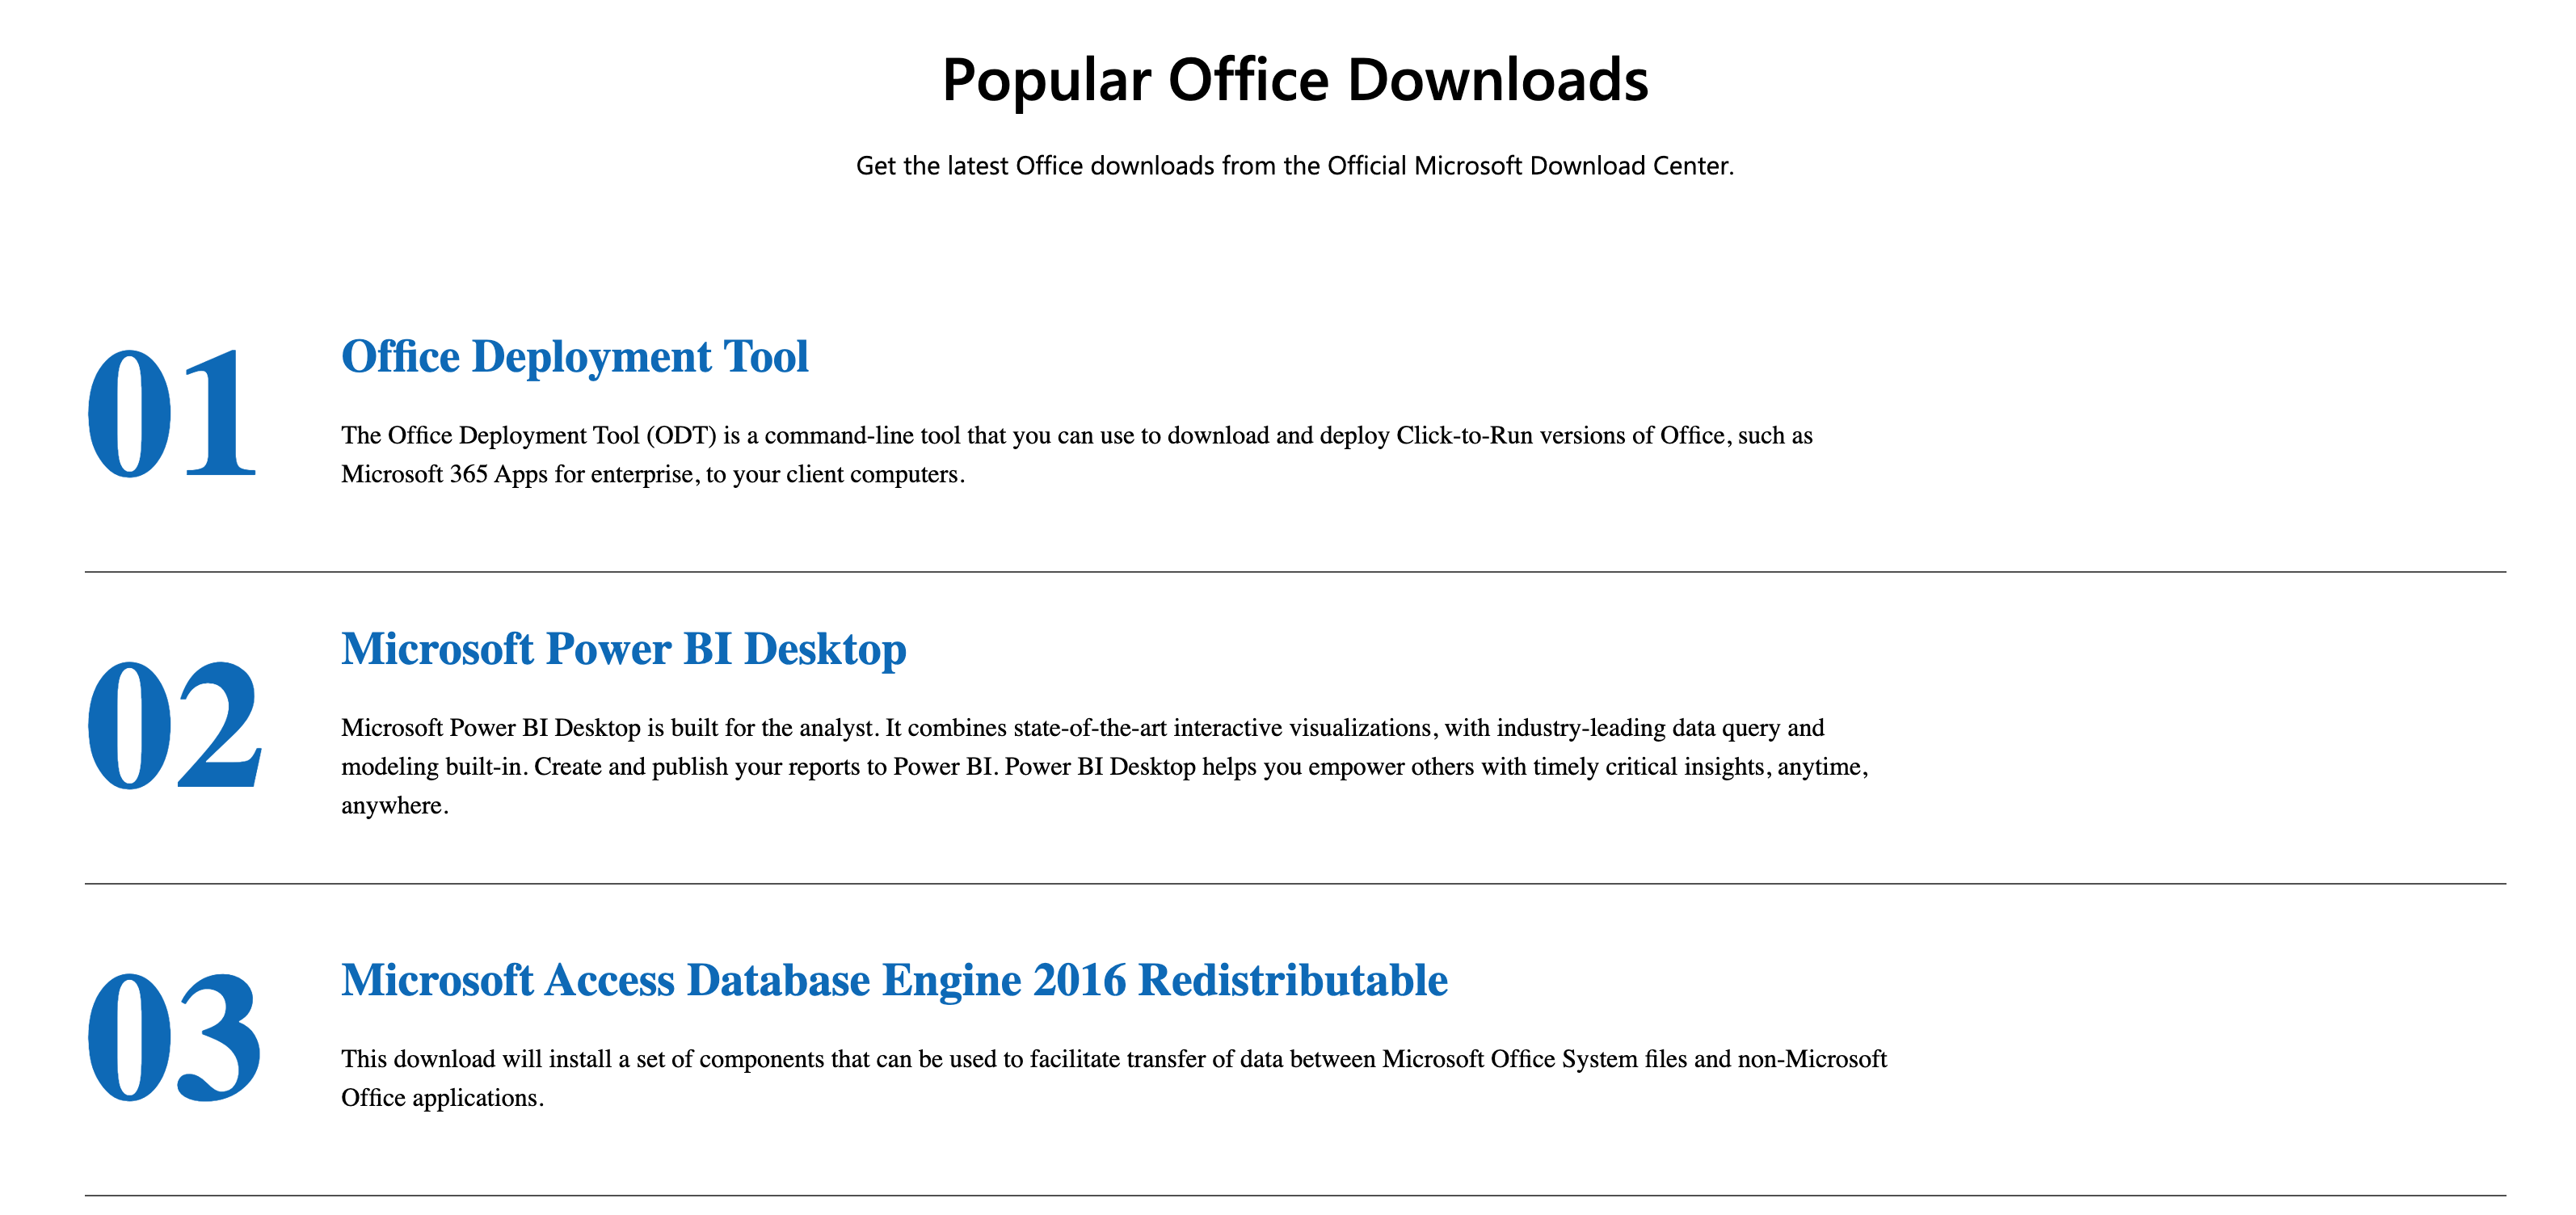

- Follow the installation wizard to set up the tool.
Step 2: Connecting to Data Sources
Power BI supports a wide variety of data sources, including:
- Excel files
- SQL databases
- Online services like SharePoint, Google Analytics, and Salesforce
How to Connect:
-
Open Power BI Desktop.
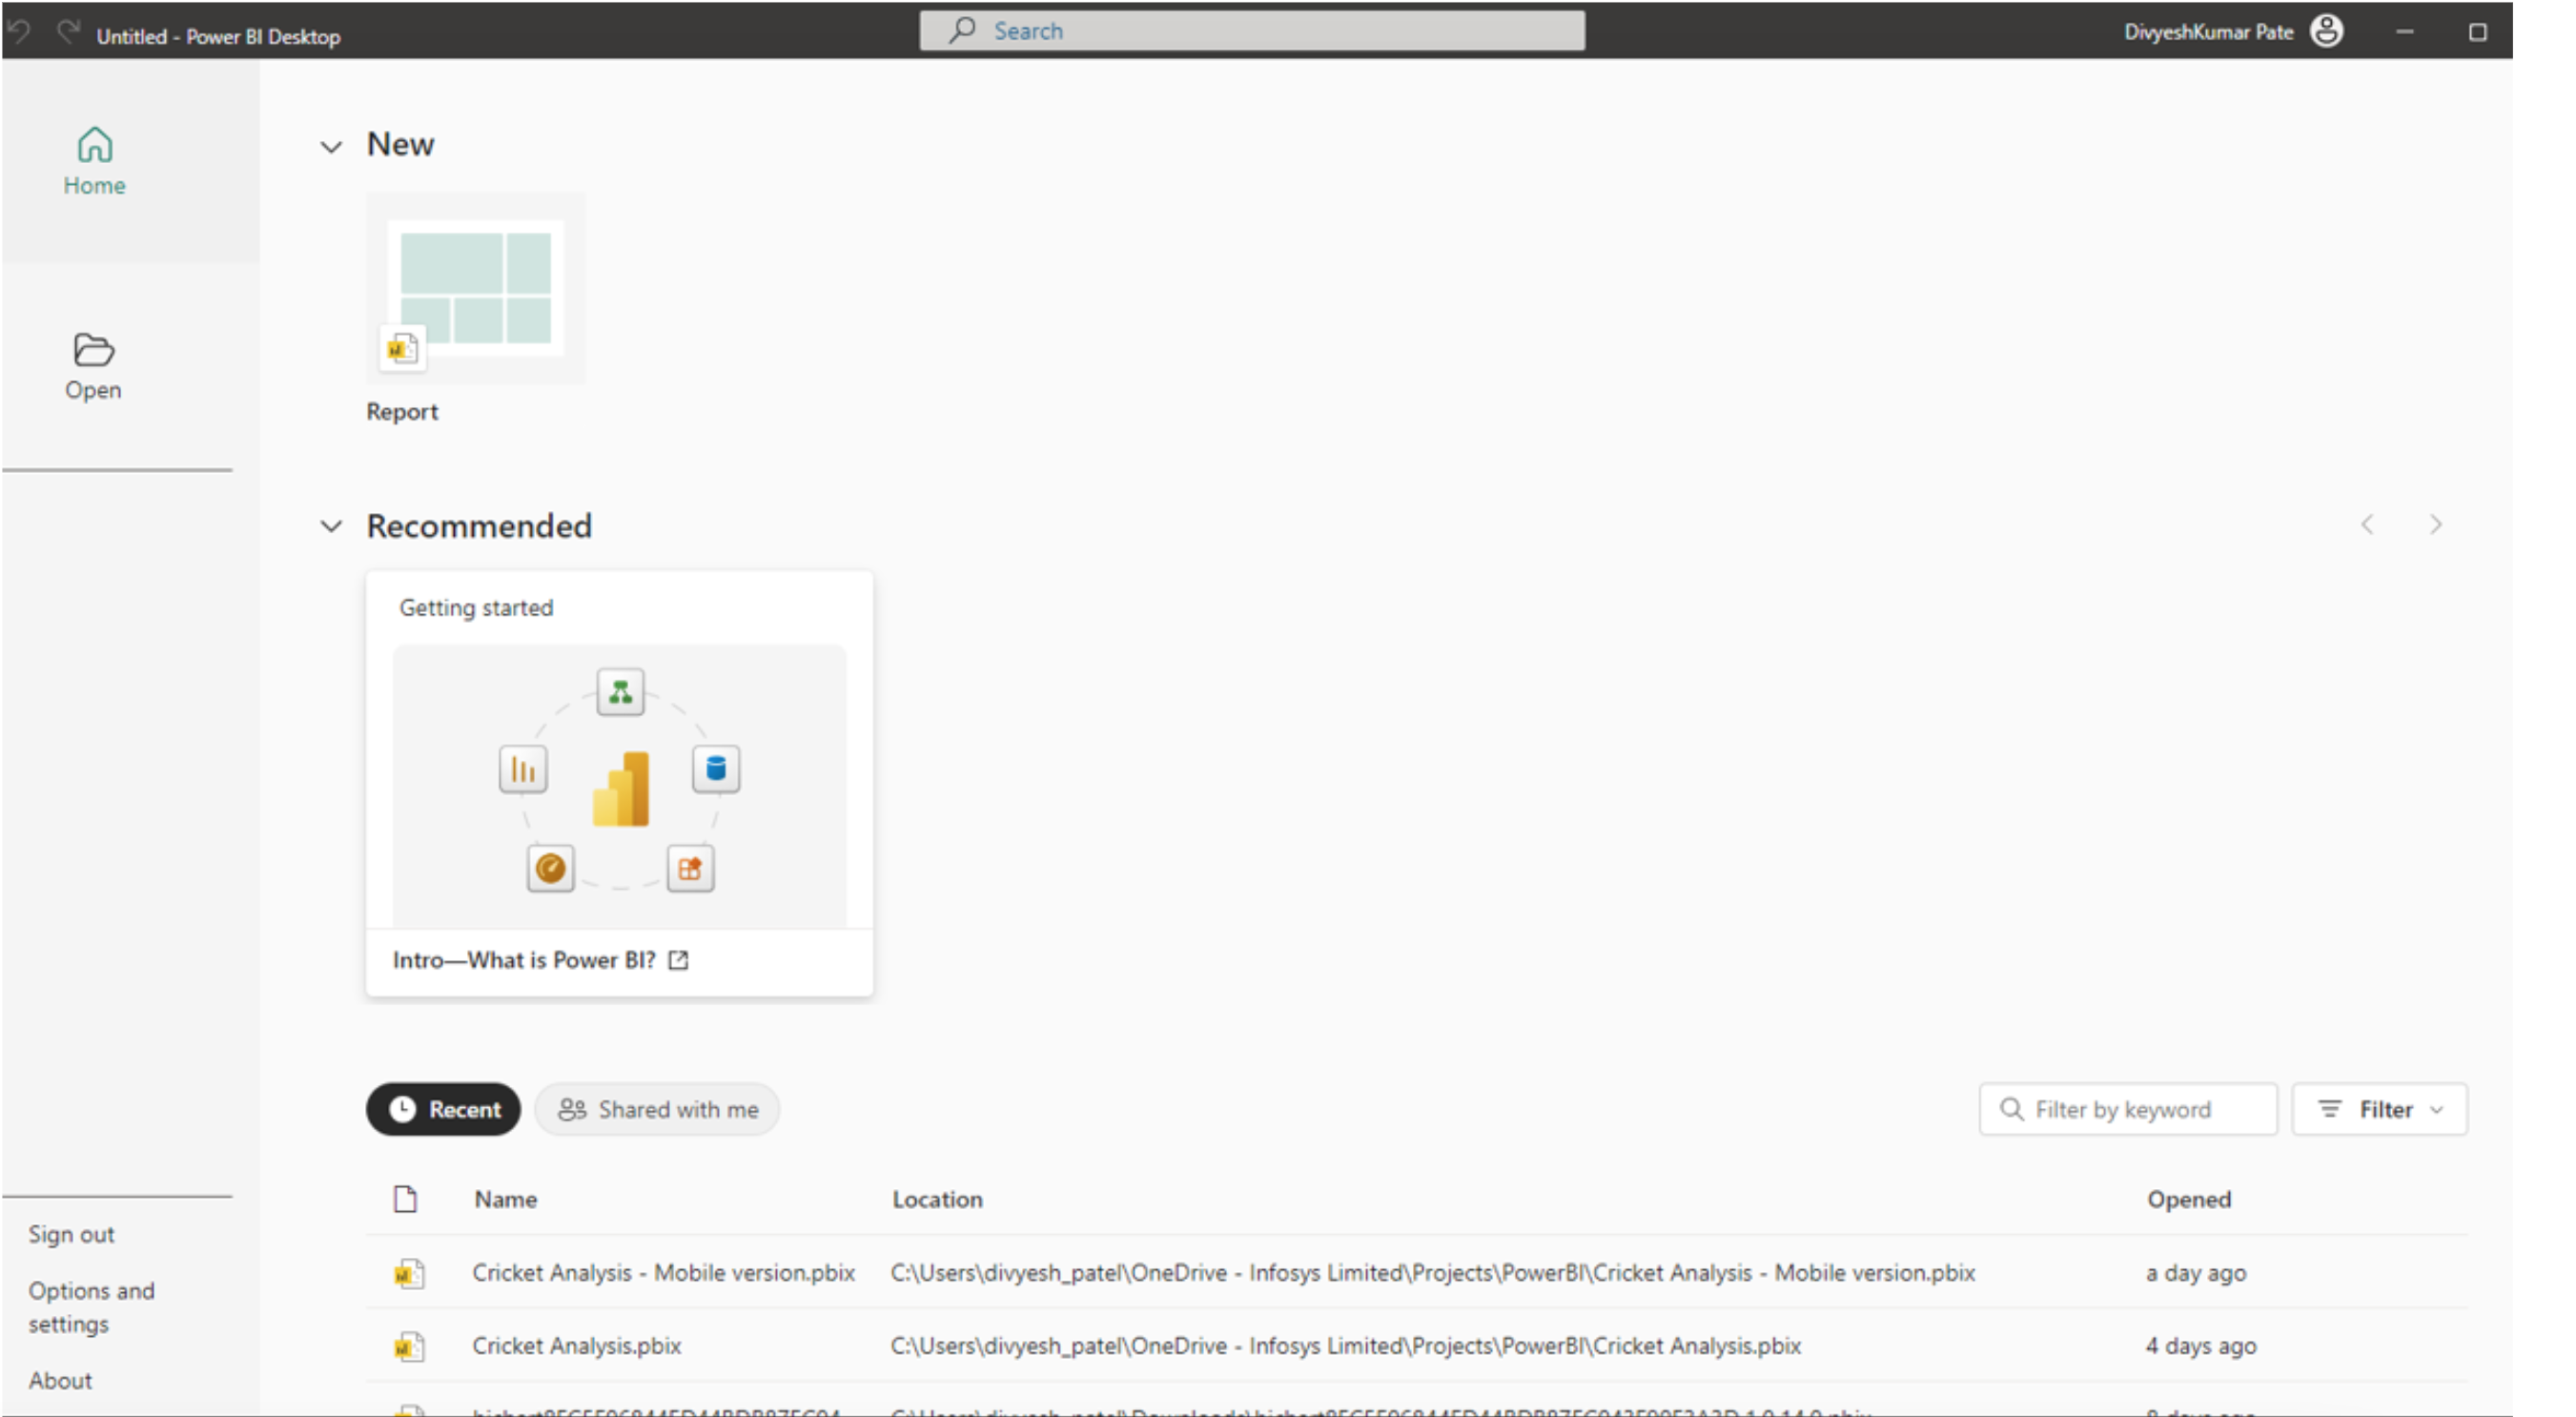
-
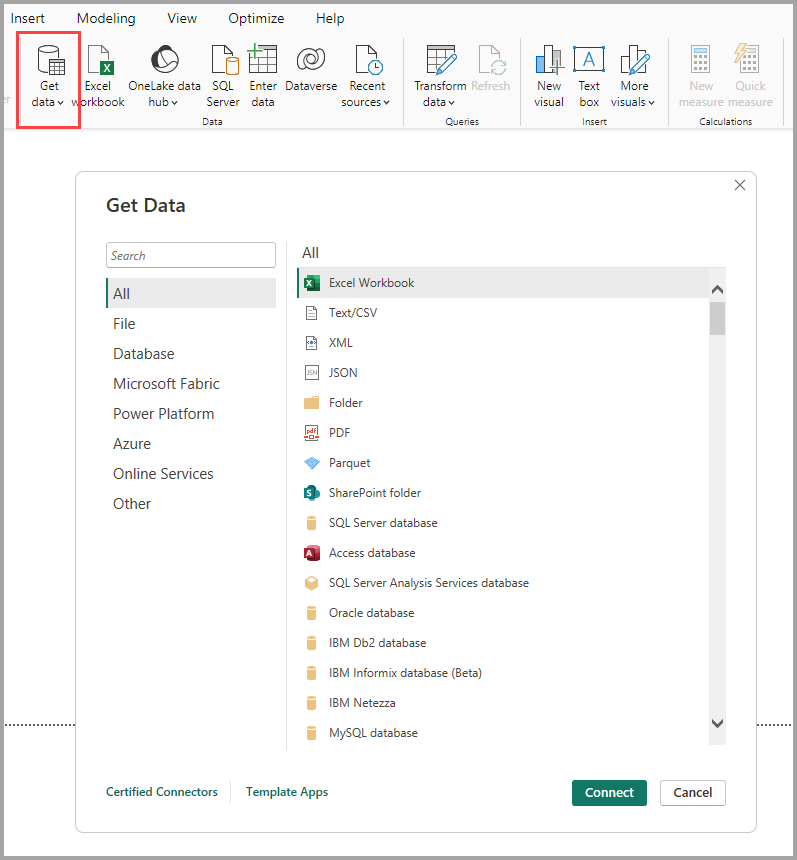
Click on Get Data from the Home tab.
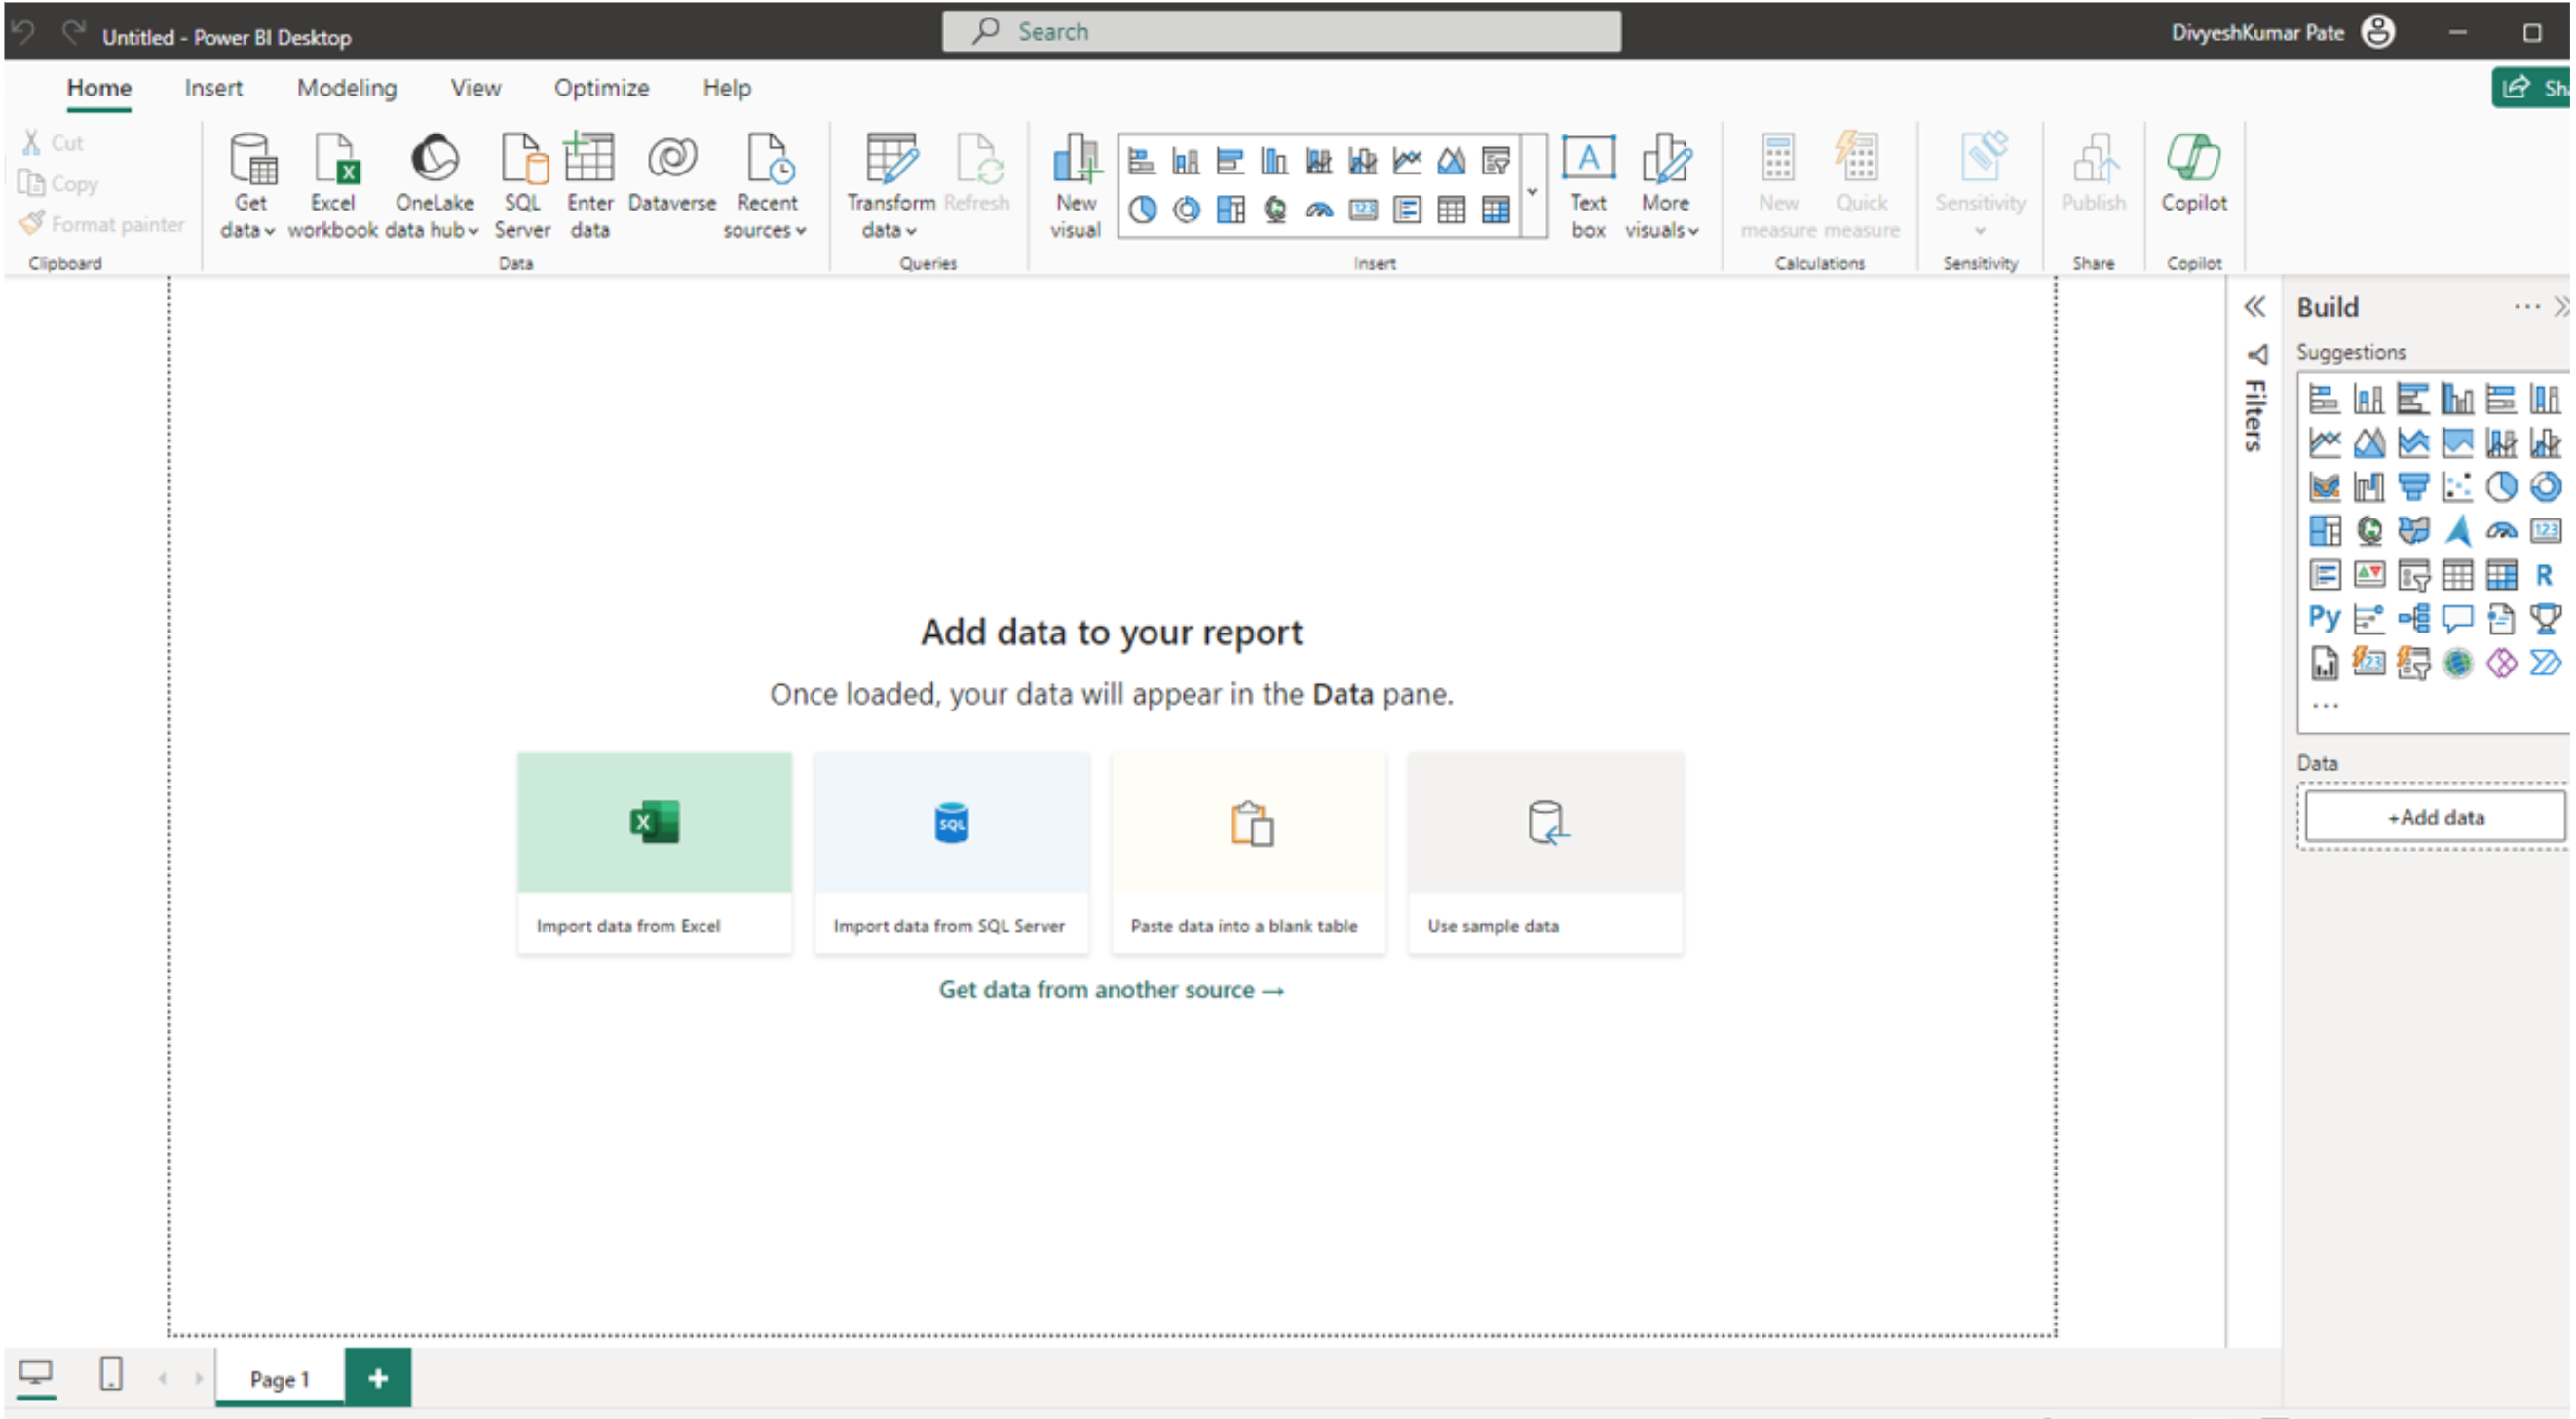
-
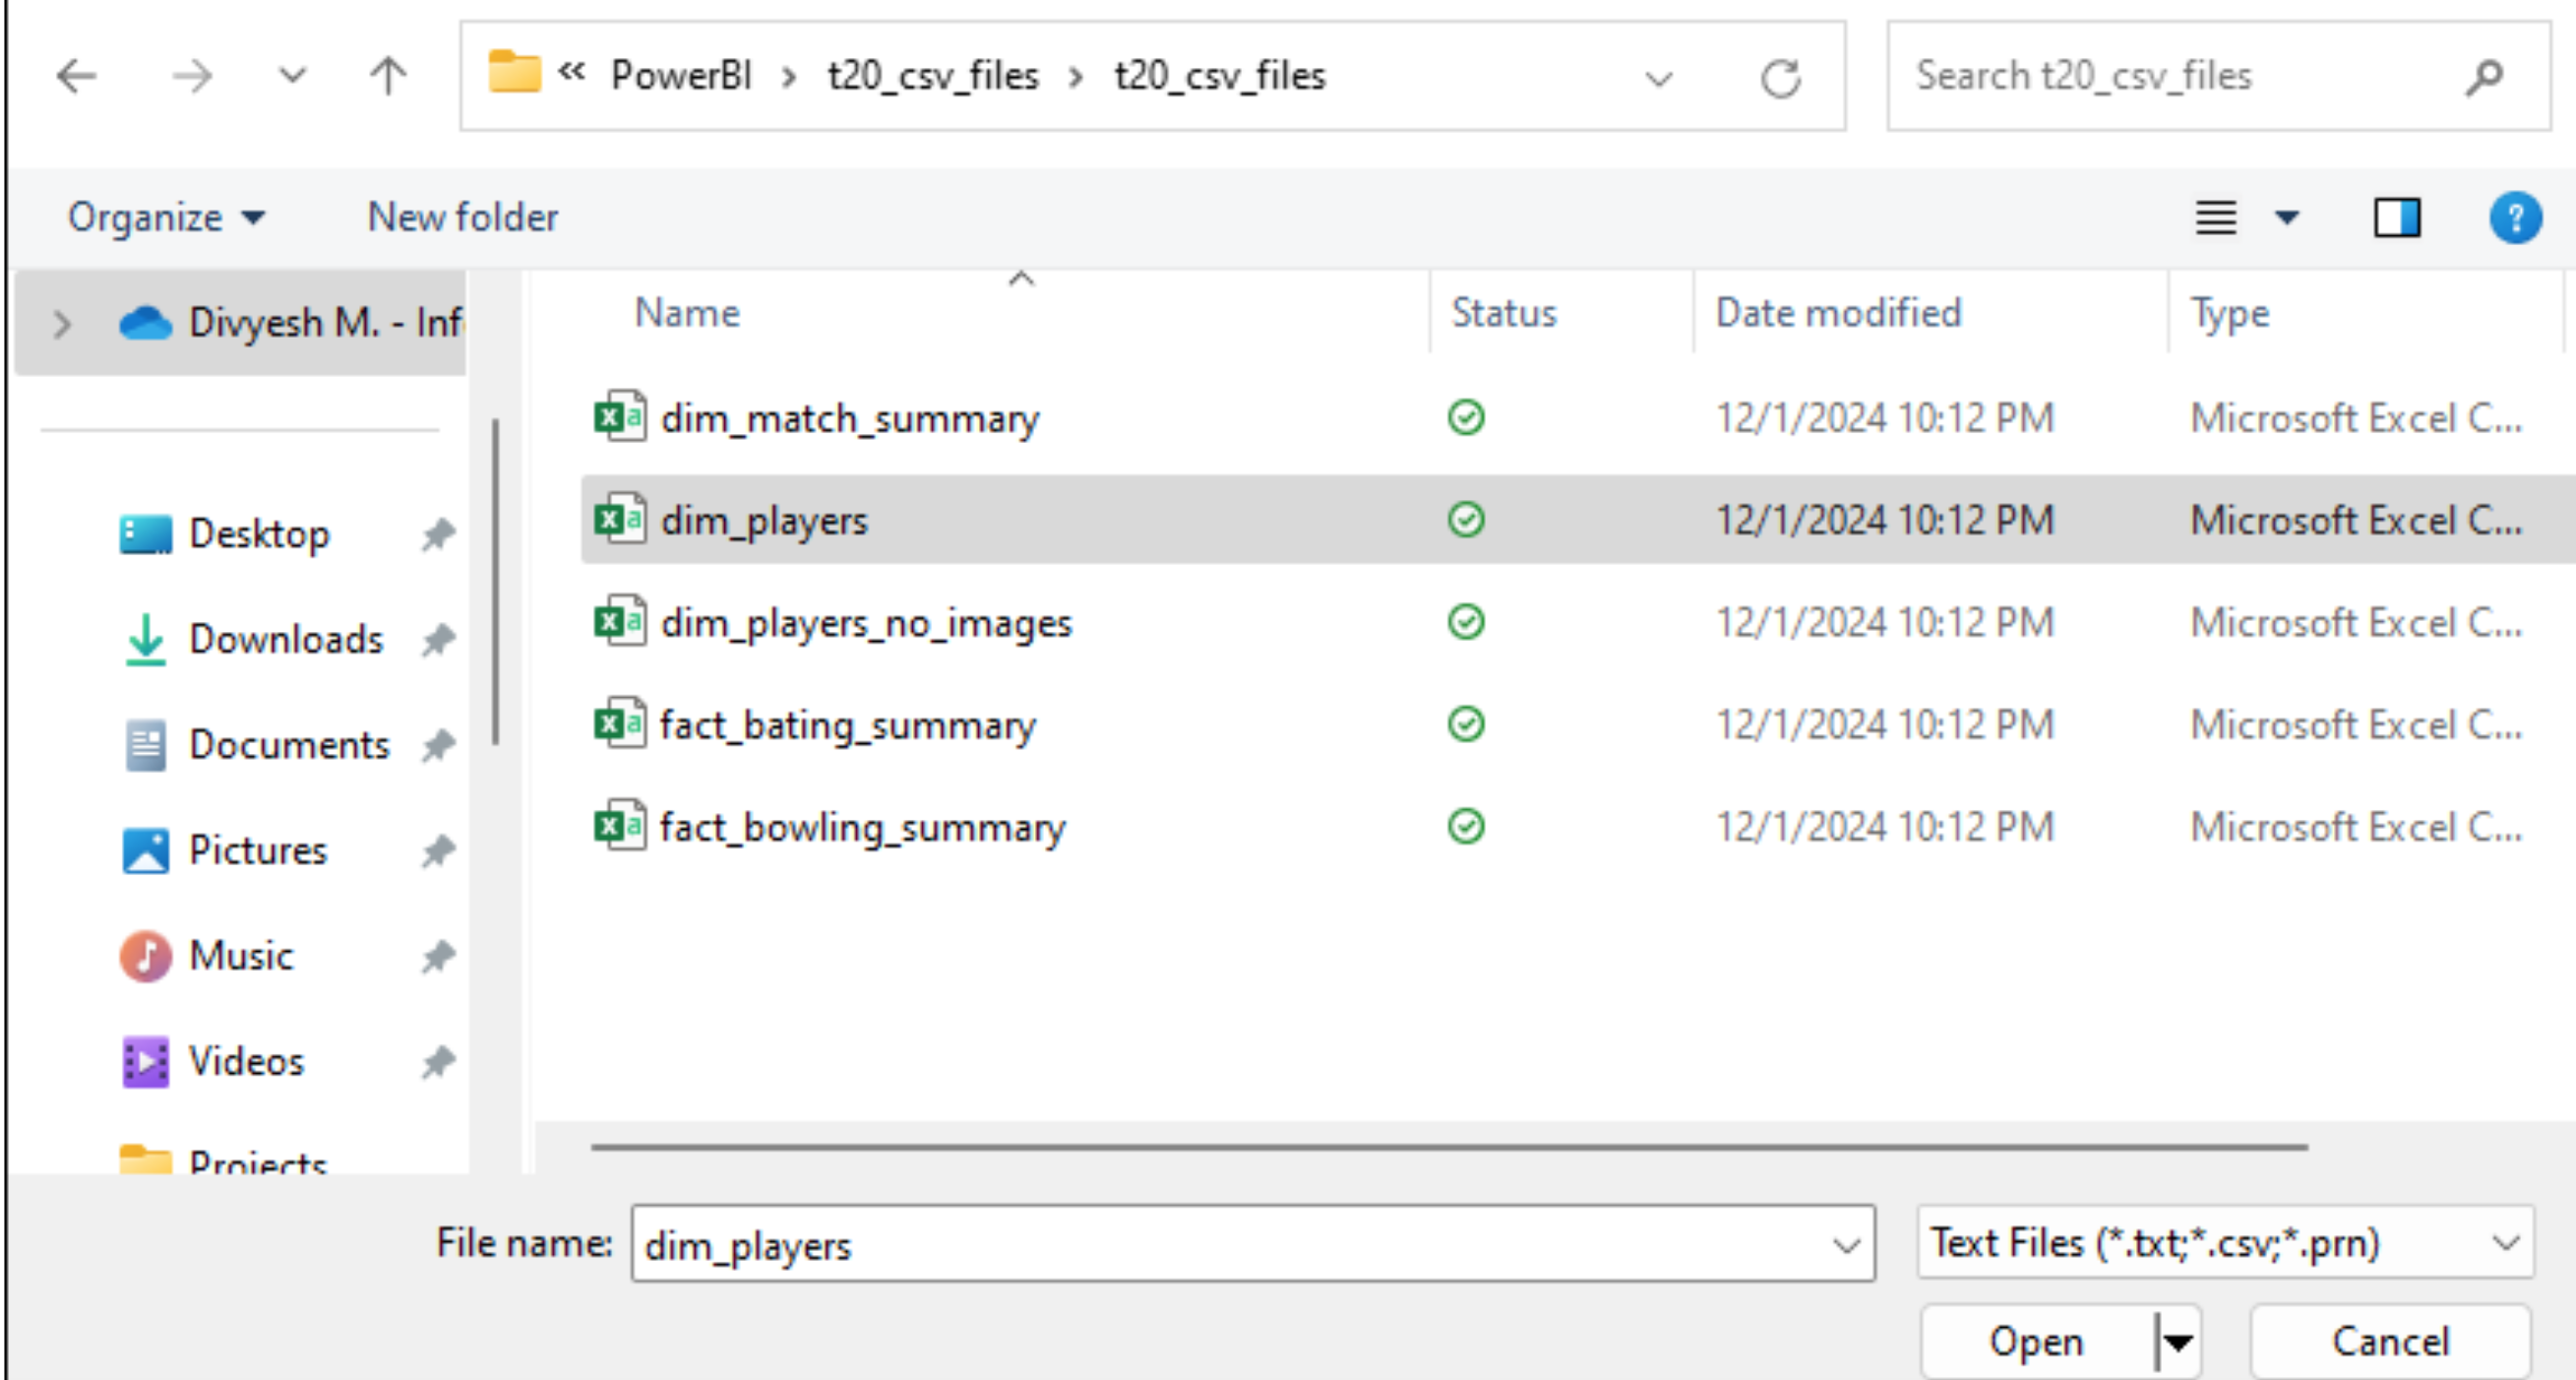
Choose your data source (e.g., Excel).
-
Load the data into Power BI by clicking Load or prepare it for transformation using Transform Data.
Step 3: Transforming Data with Power Query
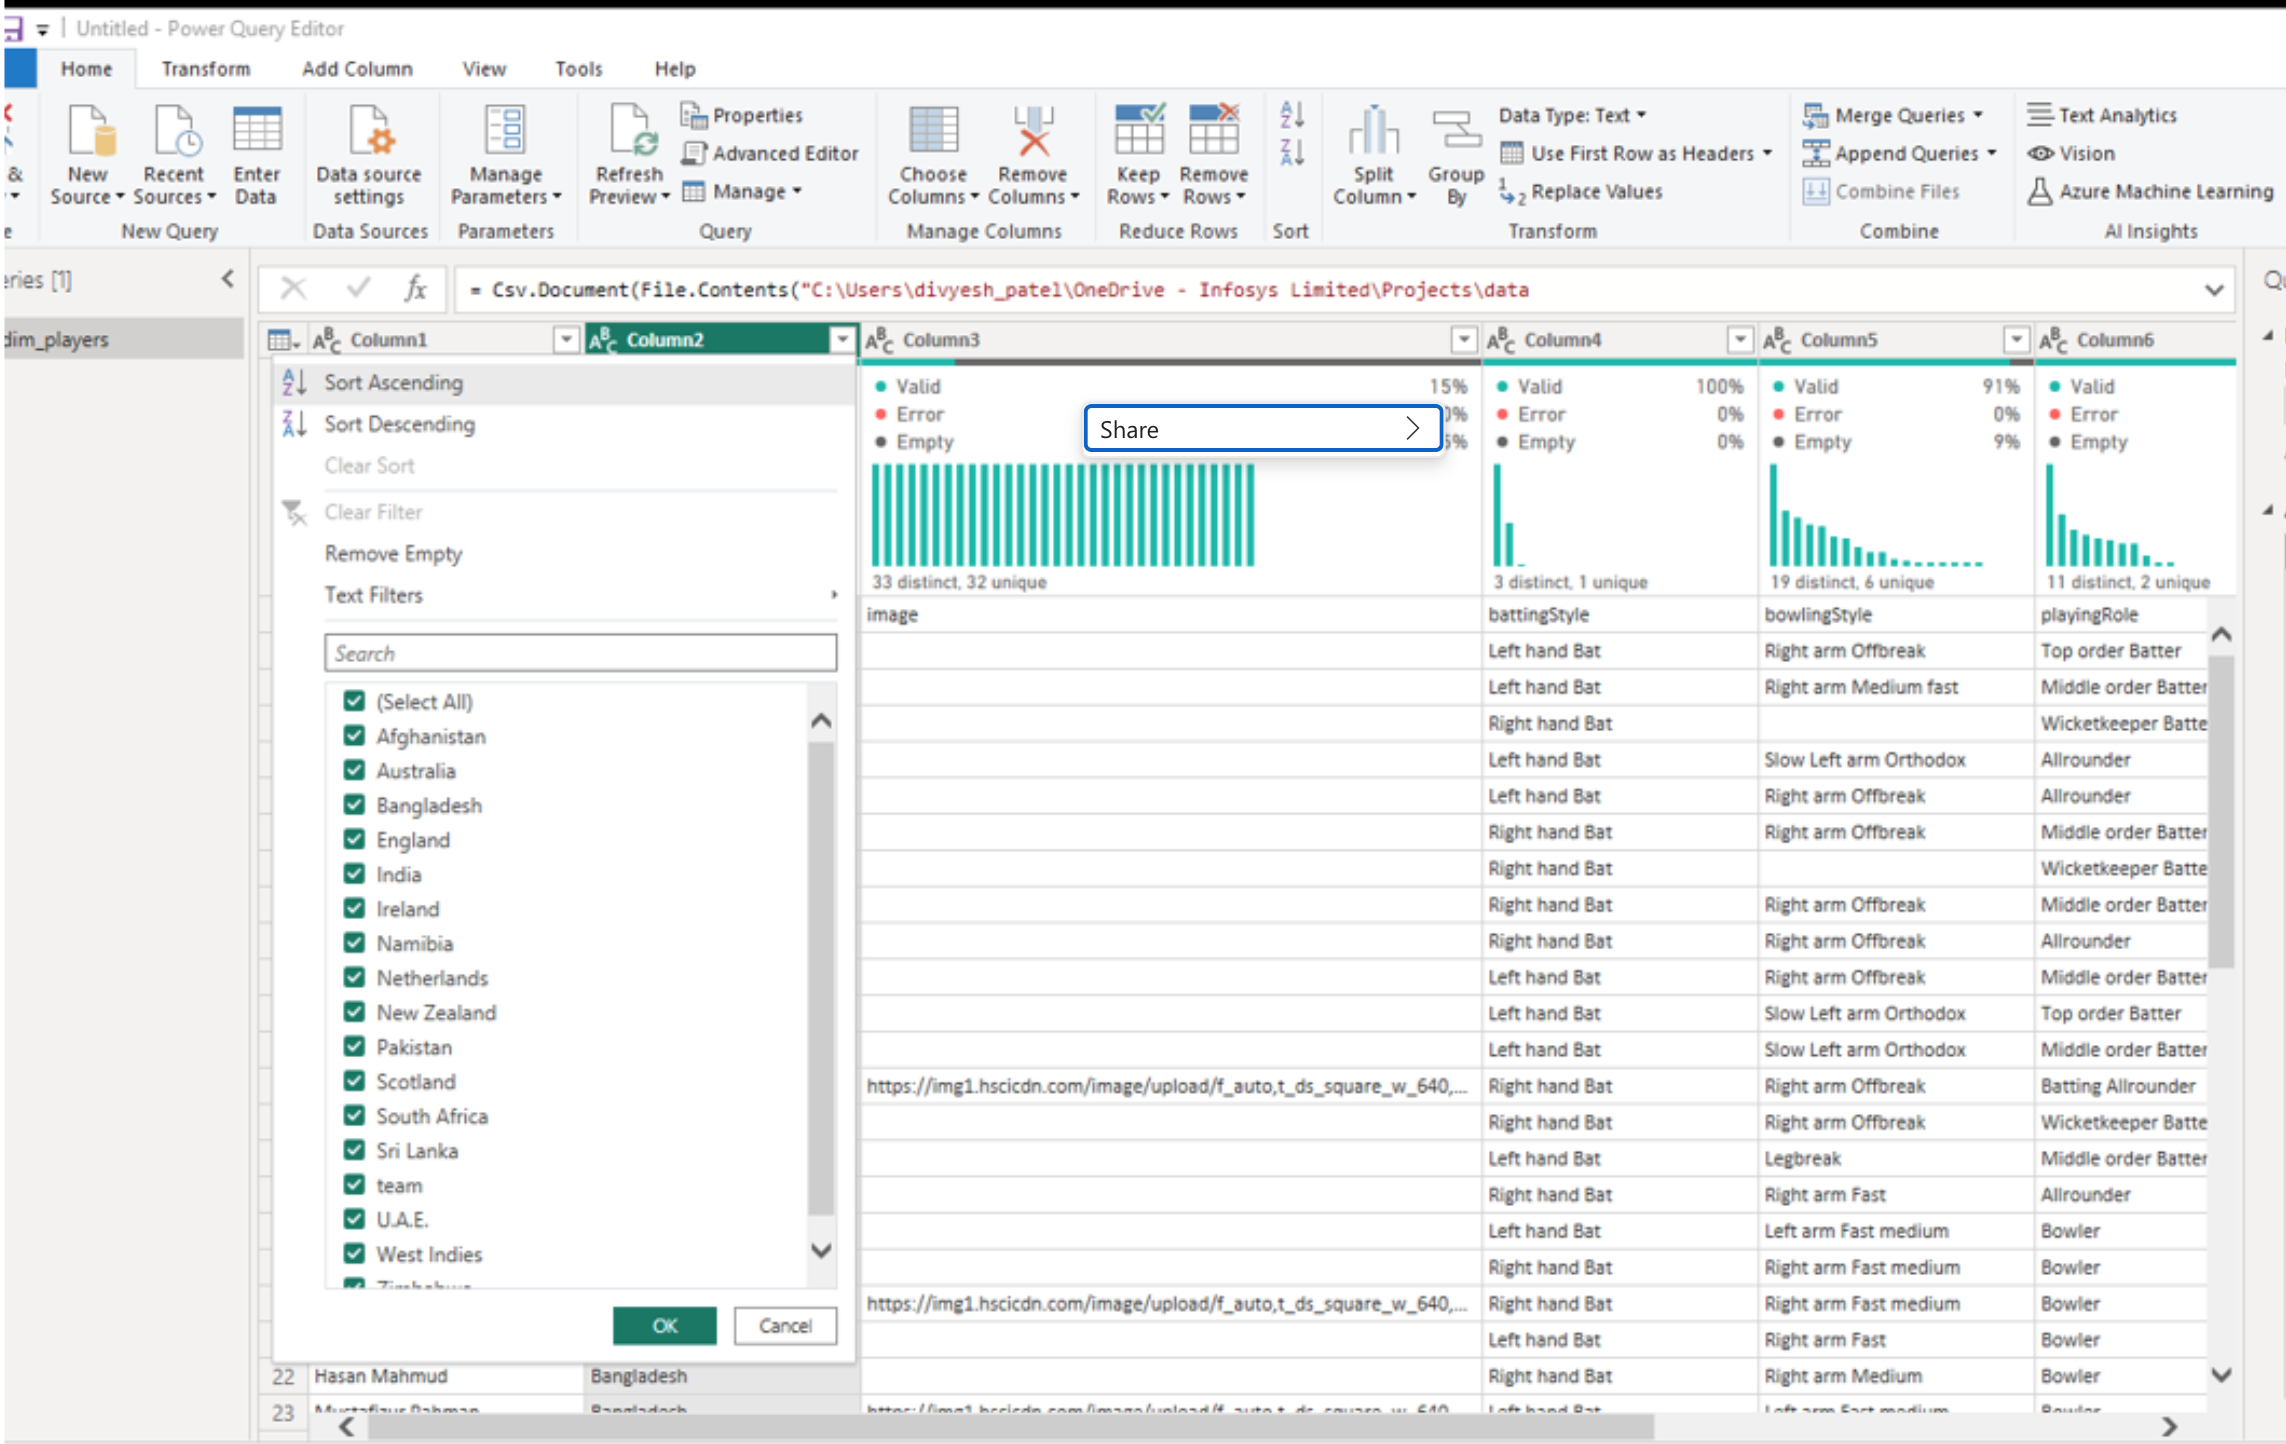
Before visualizing your data, you may need to clean or transform it. Power Query is a tool in Power BI that allows you to:
- Remove duplicates
- Filter rows
- Split columns
- Change data types
Example: If you’re working with sales data, you can filter out null values or merge columns to create a full name from first and last names.


Step 4: Creating Your First Visualization
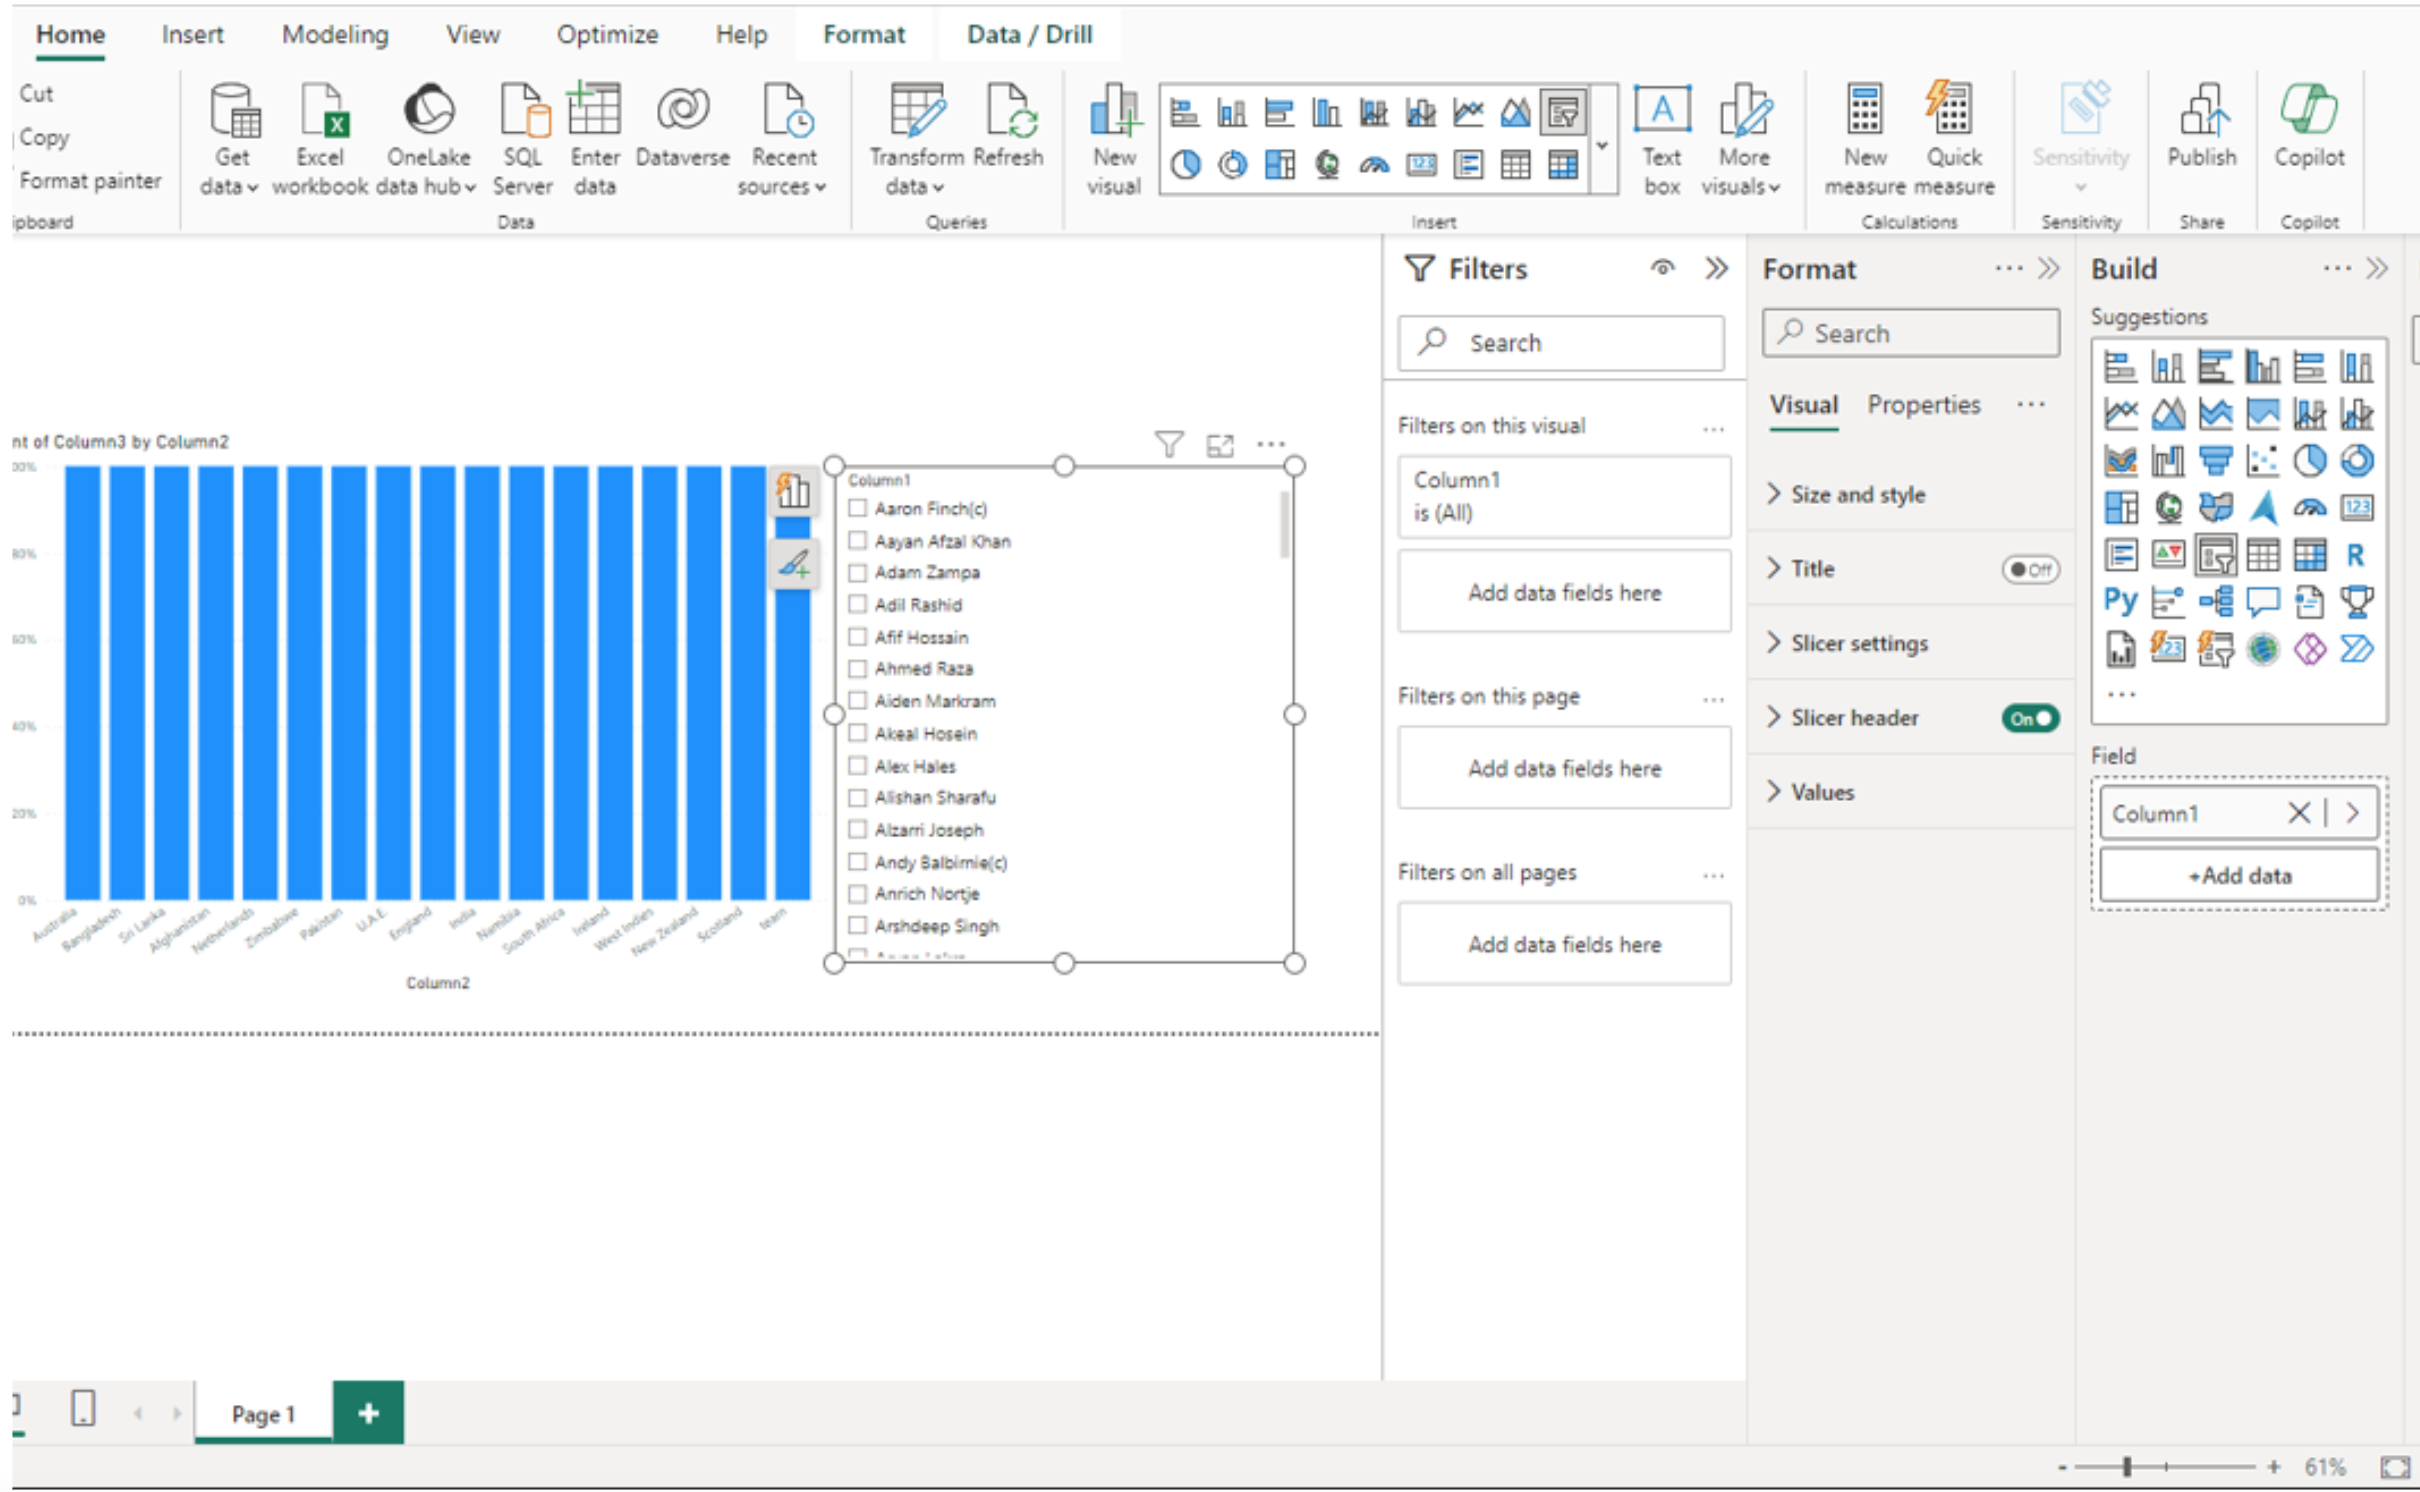
Visualizations in Power BI help you present data in an easily understandable format. Here’s how you can create one:
- Load Your Data: Ensure your data is loaded and cleaned.
- Select a Visualization: Use the Visualizations pane to select a chart type (e.g., bar chart, pie chart, or map).
- Drag and Drop Fields: Drag fields from the Fields pane into the chart axes.
- Customize Your Chart: Use the Format pane to adjust colors, labels, and other settings.
Step 5: Building Your First Dashboard
Once you’ve created visualizations, you can compile them into a dashboard:
- Pin Visuals: Click the “Pin” icon on a chart to add it to a dashboard.
- Organize Your Dashboard: Arrange your visuals for clarity.
- Add Filters: Use slicers or filters to make your dashboard interactive.
Tips for Beginners
- Start Small: Begin with simple datasets to familiarize yourself with the tool.
- Use Templates: Leverage pre-built Power BI templates to save time.
- Learn Shortcuts: Keyboard shortcuts can improve your efficiency.
- Explore Power BI Service: Publish your dashboard to Power BI Service to share with others.
Why Learn Power BI?
Power BI is widely used across industries for its simplicity, versatility, and scalability. As a beginner, mastering this tool can:
- Enhance your data analysis skills
- Make you a valuable asset in data-driven roles
- Provide insights that drive decision-making
Conclusion
Getting started with Power BI is an exciting journey for anyone looking to explore data analytics. By following this guide, you’ll be able to connect data sources, clean data, and build your first interactive dashboard. Ready to start? Download Power BI Desktop today and unlock the power of your data!
FAQs
Is Power BI free?
Yes, Power BI Desktop is free to download and use. However, advanced features like collaboration and sharing may require a paid subscription.
Can I use Power BI without coding?
Absolutely! Power BI has a user-friendly interface that doesn’t require coding knowledge. However, learning DAX (Data Analysis Expressions) can be beneficial for advanced calculations.
What are the system requirements for Power BI Desktop?
Power BI Desktop runs on Windows and requires at least 2GB of RAM, though 4GB or more is recommended for large datasets.
Start your Power BI journey today and transform the way you analyze data!